. 2010 Mar;120(3):883-93.
doi: 10.1172/JCI40926. Epub 2010 Feb 22.

Activated regulatory T cells are the major T cell type emigrating from the skin during a cutaneous immune response in mice

Affiliations

Activated regulatory T cells are the major T cell type emigrating from the skin during a cutaneous immune response in mice

Michio Tomura et al. J Clin Invest. 2010 Mar.

Abstract

Tregs play an important role in protecting the skin from autoimmune attack. However, the extent of Treg trafficking between the skin and draining lymph nodes (DLNs) is unknown. We set out to investigate this using mice engineered to express the photoconvertible fluorescence protein Kaede, which changes from green to red when exposed to violet light. By exposing the skin of Kaede-transgenic mice to violet light, we were able to label T cells in the periphery under physiological conditions with Kaede-red and demonstrated that both memory phenotype CD4+Foxp3- non-Tregs and CD4+Foxp3+ Tregs migrated from the skin to DLNs in the steady state. During cutaneous immune responses, Tregs constituted the major emigrants and inhibited immune responses more robustly than did LN-resident Tregs. We consistently observed that cutaneous immune responses were prolonged by depletion of endogenous Tregs in vivo. In addition, the circulating Tregs specifically included activated CD25hi Tregs that demonstrated a strong inhibitory function. Together, our results suggest that Tregs in circulation infiltrate the periphery, traffic to DLNs, and then recirculate back to the skin, contributing to the downregulation of cutaneous immune responses.


Figures
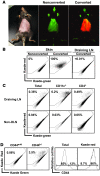
Figure 1
Figure 1. Cell migration from the skin to the DLN in the steady state.
(A) Kaede-Tg mice were photoconverted on the clipped abdominal skin as described in Methods and observed with a fluorescence stereoscopic microscope. Nonphotoconverted clipped skin is shown as a control (middle). Note: nonclipped area remains black since light cannot reach. (B) Skin and draining axillary LN cells resected immediately after violet light exposure of the abdominal skin and resected skin cells not exposed to violet light were subjected to flow cytometric analysis to evaluate the photoconversion. (C and D) Twenty-four hours after photoconversion of the abdominal skin, cells from the draining axillary and other nondraining cervical and popliteal peripheral LNs were stained with CD11c and CD4 mAbs (C) and CD4 and CD44 mAbs (D) and subjected to flow cytometry. These data are representative of at least 5 experiments. Numbers within plots or histograms (BD) indicate percentage of cells in the respective areas.
Figure 2
Figure 2. Migration of Tregs from the skin to DLNs.
(AE) The DLN cells of Kaede/Foxp3hCD2/hCD52 mice photoconverted on the abdomen 24 hours prior were stained with CD4, CD25, and hCD2 mAbs. Shown here are the flow cytometric plots for hCD2/Foxp3 and CD25 staining among CD4+ cells (A) and Kaede-red and Kaede-green expression on hCD2+CD4+ cells among skin DLN cells (B). (C) The DLNs and non-DLNs from the mice 24 hours after photoconversion were stained with CD4, hCD2, and CD44 mAbs and subjected to flow cytometry. (D) hCD2/Foxp3 expression in total (Kaede-red plus Kaede-green), Kaede-red, and Kaede-green CD4 cells was compared by flow cytometry. (E) The numbers of CD44mid naive (M), CD44hi memory (H), and naive plus memory (H/M) phenotypes of hCD2CD4+ non-Tregs (–), hCD2+CD4+ Tregs (+), and total (hCD2 and hCD2+; +/–) CD4+ T cells in total CD4+ (Kaede-red plus Kaede-green) cells and Kaede-red cells in the DLNs were counted. Data are presented as means ± SD and are representative of 3 independent experiments. Student’s t test was performed between the indicated groups. *P < 0.05. Numbers within plots or histograms indicate percentage of cells in the respective areas (AD).
Figure 3
Figure 3. Cell migration from the skin to DLN during a cutaneous immune response.
(A) Scheme of the experimental protocol is as follows: the dorsal skin of Kaede/Foxp3hCD2/hCD52 was sensitized, and 5 days thereafter the abdominal skin was challenged. 2 days after challenge, the painted areas were photoconverted, and 24 hours after photoconversion, cells from the skin DLNs were analyzed by flow cytometry. (B and C) The frequency of Kaede-red and Kaede-green cells among CD4+ cells, and the frequencies of hCD2/Foxp3+ cells in total, Kaede-green, and Kaede-red cells among CD4+ cells were analyzed. Numbers within plots or histograms indicate percentage of cells in the respective areas. (D) The numbers of CD44mid naive (M), CD44hi memory (H), and naive plus memory (H/M) phenotypes of hCD2CD4+ non-Tregs (–), hCD2+CD4+ Tregs (+), and total (hCD2 and hCD2+; +/–) CD4+ T cells among total CD4+ cells and Kaede-red cells in the DLNs were counted. (E) Number of Tregs and non-Tregs in the skin. The mice were painted with DNFB or vehicle on the abdomen, followed by DNFB or vehicle application on the ears. The number of CD4+ Tregs and CD4+ non-Tregs and the percentage ratio of Tregs among CD4+ T cells in the ears were measured. (F) Transwell assay. The number of hCD2+CD4+ cells and CD11c+ cells of skin-cell suspensions from Foxp3hCD2/hCD52 mice that migrated to the lower chamber was analyzed. Data are presented as means ± SD (DF) and are representative of 3 independent experiments. Student’s t test was performed between the indicated groups. *P < 0.05 (DF).
Figure 4
Figure 4. Enhanced ear swelling response by Treg depletion and immunosuppressive activity of Treg subsets on T cell proliferation in vitro.
(A) The number of Tregs in the LNs after administration of Campath-1G Ab. (B) CHS: the Kaede/Foxp3hCD2/hCD52 mice were sensitized, and injected with vehicle or Campath-1G Ab before challenge (n = 8 for each group). (CF) Immunosuppressive activity of Tregs. Kaede-red and Kaede-green Tregs were sorted from the Kaede/Foxp3hCD2/hCD52 mice, sensitized, challenged, and photoconverted. (C) Skin DLN cells of mice sensitized with DNFB were stimulated with DNBS in the presence or absence of Kaede-red Tregs or Kaede-green Tregs in vitro (n = 3). (D) Suppressive effect of Tregs in vitro. Kaede-red and Kaede-green Tregs were prepared as above and added to T cells stimulated with plate-bound anti-CD3 Ab. (E) Antigen specificity of Treg functions. LN cells from DNFB-sensitized or TNCB-sensitized mice were stimulated with DNBS or TNBS in vitro. Kaede-red and Kaede-green Tregs were added, and percentage inhibition of cell proliferation was evaluated as follows: (cell proliferation with DNBS or TNBS) – (cell proliferation with DNBS or TNBS in the presence of Tregs)/(cell proliferation with DNBS or TNBS) – (cell proliferation with vehicle) × 100. (F) Quantitative RT-PCR analysis on mRNA for Il10 (IL-10), Tgfb1 (TGF-β), and Ctla4 (CTLA-4) of Kaede-red Tregs and Kaede-green Tregs. The expression of each gene was normalized by the expression of Gapdh, and those in Kaede-green non-Tregs were normalized to 1 (n = 3). Data are representative of 3 independent experiments and presented as means ± SD (AF). *P < 0.05 between the indicated groups (Student’s t test, A, B, E, and F; 1-way ANOVA followed by Dunnett multiple comparison test, C and D).
Figure 5
Figure 5. Immunosuppressive effect of Kaede-red Tregs in the skin.
(A) Suppression of CHS response by Kaede-red Tregs. Kaede-red or Kaede-green Tregs (4 × 10³ cells/ear) of Kaede/Foxp3hCD2/hCD52 mice sensitized, challenged, and photoconverted as in Figure 3A were injected into ear skin of mice sensitized with DNFB 5 days prior. Immediately after injection, the mice were challenged, and the ear thickness change was measured at 48, 72, and 96 hours after challenge. (BD) The mice were sensitized, challenged, and photoconverted as in Figure 3A. Twenty-four hours after photoconversion, 20 μl of 0.3% DNFB (challenge; +) or vehicle (challenge; –) (B) or 20 μl of 0.3% DNFB or 20 μl of 1% TNCB (C) was painted onto the ear. Twenty-four hours later, the ear skin and blood (D) were collected and dissociated for flow cytometry. The number of Kaede-red Tregs in the skin and the frequency of Kaede-red Tregs in CD4+ T cell subset of the blood were evaluated (n = 3, each group). Data are presented as means ± SD and representative of 3 independent experiments (AC). Student’s t test was performed between the indicated groups. *P < 0.05. Numbers within plots indicate percentage of cells in the respective areas (D).
Figure 6
Figure 6. Surface molecule expressions on Kaede-red and Kaede-green cells.
(A) Chemokine receptor expression. Skin DLN cells were prepared from the mice sensitized, challenged, and photoconverted as in Figure 3A. These LN cells were stained with isotype-matched control, CCR4, CCR5, and CCR7 mAbs, and the expression levels of Kaede-red and Kaede-green Tregs were evaluated by flow cytometry. (B) Transwell assay. DLN cells were transferred to the upper chamber of the transwell, and CCL17 or CCL21 was added to the lower chamber. The cells were incubated for 3 hours, and the numbers of Kaede-red and Kaede-green cells that migrated to lower chamber were analyzed by flow cytometry. Data are presented as means ± SD and representative of 2 independent experiments. Student’s t test was performed between the indicated groups. *P < 0.05. (C) Surface molecule expression. LN cells were stained with isotype-matched control, CD62L, CD44, CD69, CD25, and CD103 mAbs, and the expression levels were evaluated by flow cytometry. These data are representative of 3 independent experiments.
Figure 7
Figure 7. Kinetics and suppression activity of CD25hi Kaede-red migratory Tregs.
(AC) Characterization of CD25hi subset. Kaede/Foxp3hCD2/hCD52 mice were treated as in Figure 3A, and the expression levels of hCD2/Foxp3 and CD25 on CD4+hCD2/Foxp3+ Tregs in total, Kaede-red, and Kaede-green DLN cells and in non-DLN cells (A), the frequency of Kaede-red populations in each population (B), and the expression levels of surface markers on Kaede-red or Kaede-green Tregs in the DLNs (C) were analyzed. (D) Kinetics of T cell migration. Kaede/Foxp3hCD2/hCD52 mice were sensitized and challenged as in Figure 3A and photoconverted immediately (day 0), 1 (day 1), 2 (day 2), or 3 (day 3) days after challenge. The number of each subset migrating for 24 hours after photoconversion and the frequency of Kaede-red cells among each subset were measured. (E) Foxp3hCD2/hCD52 mice were sensitized with DNFB (S+) and challenged with DNFB (C+) or vehicle (C–). Skin suspensions were evaluated for the expression of hCD2/Foxp3 and CD25. (F) Skin DLNs cells of sensitized B6 mice were stimulated in the absence or presence of Kaede-red total hCD2+ Tregs (25hi/int), CD25hi Tregs (25hi), or CD25int Tregs (25int). (G) mRNAs for Il10 (IL-10), Tgfb1 (TGF-β), and Ctla4 (CTLA-4) of Kaede-green CD25int or CD25hi Tregs, Kaede-red CD25int or CD25hi Tregs, or Kaede-green CD25int Tregs in DLNs (D) or non-DLNs (N) were evaluated. The expression level in Kaede-green CD25int Tregs was normalized to 1. Data are presented as means ± SD (n = 3) (D, F, and G). *P < 0.05 between indicated groups. (F and G). Numbers within plots or histograms indicate percentage of cells (A, B, and E).

Comment in

References

    1. Korn T, Bettelli E, Oukka M, Kuchroo VK. IL-17 and Th17 cells. Annu Rev Immunol. 2009;27:485–517. doi: 10.1146/annurev.immunol.021908.132710. - DOI - PubMed
    1. Sakaguchi S, Yamaguchi T, Nomura T, Ono M. Regulatory T cells and immune tolerance. Cell. 2008;133(5):775–787. doi: 10.1016/j.cell.2008.05.009. - DOI - PubMed
    1. Lu LF, Rudensky A. Molecular orchestration of differentiation and function of regulatory T cells. Genes Dev. 2009;23(11):1270–1282. doi: 10.1101/gad.1791009. - DOI - PMC - PubMed
    1. Gowans JL, Knight EJ. The route of re-circulation of lymphocytes in the rat. Proc R Soc Lond B Biol Sci. 1964;159:257–282. doi: 10.1098/rspb.1964.0001. - DOI - PubMed
    1. Gowans JL. The recirculation of lymphocytes from blood to lymph in the rat. J Physiol. 1959;146(1):54–69. - PMC - PubMed

Publication types

MeSH terms

Substances