

Comparison of AAV serotypes for gene delivery to dorsal root ganglion neurons
- PMID: 20179682
- PMCID: PMC2862541
- DOI: 10.1038/mt.2010.19
Comparison of AAV serotypes for gene delivery to dorsal root ganglion neurons
Abstract
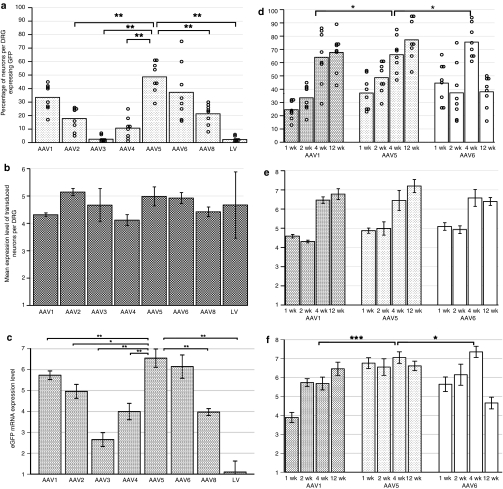
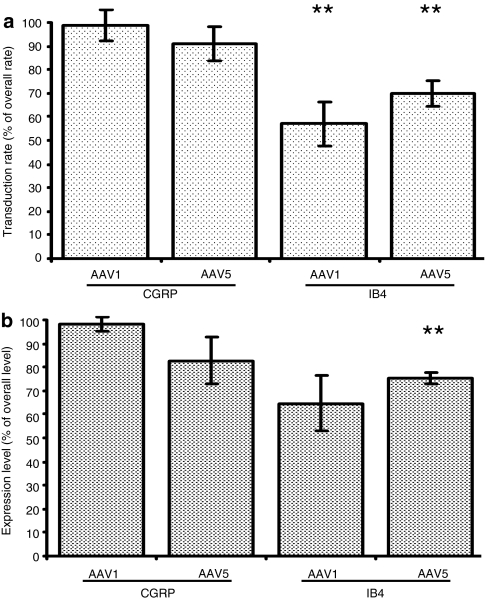
For many experiments in the study of the peripheral nervous system, it would be useful to genetically manipulate primary sensory neurons. We have compared vectors based on adeno-associated virus (AAV) serotypes 1, 2, 3, 4, 5, 6, and 8, and lentivirus (LV), all expressing green fluorescent protein (GFP), for efficiency of transduction of sensory neurons, expression level, cellular tropism, and persistence of transgene expression following direct injection into the dorsal root ganglia (DRG), using histological quantification and qPCR. Two weeks after injection, AAV1, AAV5, and AAV6 had transduced the most neurons. The time course of GFP expression from these three vectors was studied from 1 to 12 weeks after injection. AAV5 was the most effective serotype overall, followed by AAV1. Both these serotypes showed increasing neuronal transduction rates at later time points, with some injections of AAV5 yielding over 90% of DRG neurons GFP(+) at 12 weeks. AAV6 performed well initially, but transduction rates declined dramatically between 4 and 12 weeks. AAV1 and AAV5 both transduced large-diameter neurons, IB4(+) neurons, and CGRP(+) neurons. In conclusion, AAV5 is a highly effective gene therapy vector for primary sensory neurons following direct injection into the DRG.
Figures


Comment in
-
AAV provides an alternative for gene therapy of the peripheral sensory nervous system.Mol Ther. 2010 Apr;18(4):670-3. doi: 10.1038/mt.2010.41. Mol Ther. 2010. PMID: 20357781 Free PMC article. No abstract available.
Similar articles
-
Differential adeno-associated virus mediated gene transfer to sensory neurons following intrathecal delivery by direct lumbar puncture.Mol Pain. 2010 May 28;6:31. doi: 10.1186/1744-8069-6-31. Mol Pain. 2010. PMID: 20509925 Free PMC article.
-
Adeno-associated viral vector (AAV)-mediated gene transfer in the red nucleus of the adult rat brain: comparative analysis of the transduction properties of seven AAV serotypes and lentiviral vectors.J Neurosci Methods. 2010 Jan 15;185(2):257-63. doi: 10.1016/j.jneumeth.2009.10.009. Epub 2009 Oct 20. J Neurosci Methods. 2010. PMID: 19850079
-
Vector serotype screening for use in ovine perinatal lung gene therapy.J Pediatr Surg. 2016 Jun;51(6):879-84. doi: 10.1016/j.jpedsurg.2016.02.048. Epub 2016 Mar 3. J Pediatr Surg. 2016. PMID: 27032612 Free PMC article.
-
Intraventricular brain injection of adeno-associated virus type 1 (AAV1) in neonatal mice results in complementary patterns of neuronal transduction to AAV2 and total long-term correction of storage lesions in the brains of beta-glucuronidase-deficient mice.J Virol. 2003 Jun;77(12):7034-40. doi: 10.1128/jvi.77.12.7034-7040.2003. J Virol. 2003. PMID: 12768022 Free PMC article.
-
Lentivirus- or AAV-mediated gene therapy interventions in ischemic stroke: A systematic review of preclinical in vivo studies.J Cereb Blood Flow Metab. 2022 Feb;42(2):219-236. doi: 10.1177/0271678X211039997. Epub 2021 Aug 24. J Cereb Blood Flow Metab. 2022. PMID: 34427147 Free PMC article.
Cited by
-
3D Imaging of Axons in Transparent Spinal Cords from Rodents and Nonhuman Primates.eNeuro. 2015 Mar-Apr;2(2):ENEURO.0001-15.2015. doi: 10.1523/ENEURO.0001-15.2015. eNeuro. 2015. PMID: 26023683 Free PMC article.
-
Visualization of spinal afferent innervation in the mouse colon by AAV8-mediated GFP expression.Neurogastroenterol Motil. 2013 Feb;25(2):e89-100. doi: 10.1111/nmo.12057. Epub 2012 Dec 18. Neurogastroenterol Motil. 2013. PMID: 23252426 Free PMC article.
-
Mapping of the Sensory Innervation of the Mouse Lung by Specific Vagal and Dorsal Root Ganglion Neuronal Subsets.eNeuro. 2022 Apr 13;9(2):ENEURO.0026-22.2022. doi: 10.1523/ENEURO.0026-22.2022. Print 2022 Mar-Apr. eNeuro. 2022. PMID: 35365503 Free PMC article.
-
Gene therapy for neuropathic pain by silencing of TNF-α expression with lentiviral vectors targeting the dorsal root ganglion in mice.PLoS One. 2014 Mar 18;9(3):e92073. doi: 10.1371/journal.pone.0092073. eCollection 2014. PLoS One. 2014. PMID: 24642694 Free PMC article.
-
Sigma-1 receptor activity in primary sensory neurons is a critical driver of neuropathic pain.Gene Ther. 2022 Feb;29(1-2):1-15. doi: 10.1038/s41434-020-0157-5. Epub 2020 May 18. Gene Ther. 2022. PMID: 32424233 Free PMC article.
References
-
- Kaplitt MG, Leone P, Samulski RJ, Xiao X, Pfaff DW, O'Malley KL, et al. Long-term gene expression and phenotypic correction using adeno-associated virus vectors in the mammalian brain. Nat Genet. 1994;8:148–154. - PubMed
-
- McCown TJ, Xiao X, Li J, Breese GR., and , Samulski RJ. Differential and persistent expression patterns of CNS gene transfer by an adeno-associated virus (AAV) vector. Brain Res. 1996;713:99–107. - PubMed
-
- Peel AL, Zolotukhin S, Schrimsher GW, Muzyczka N., and , Reier PJ. Efficient transduction of green fluorescent protein in spinal cord neurons using adeno-associated virus vectors containing cell type-specific promoters. Gene Ther. 1997;4:16–24. - PubMed
-
- Klein RL, Meyer EM, Peel AL, Zolotukhin S, Meyers C, Muzyczka N, et al. Neuron-specific transduction in the rat septohippocampal or nigrostriatal pathway by recombinant adeno-associated virus vectors. Exp Neurol. 1998;150:183–194. - PubMed
-
- Peel AL., and , Klein RL. Adeno-associated virus vectors: activity and applications in the CNS. J Neurosci Methods. 2000;98:95–104. - PubMed
Publication types
MeSH terms
LinkOut - more resources
Full Text Sources
Other Literature Sources
Medical
Research Materials
