Unmasking chaotic attributes in time series of living cell populations
- PMID: 20179755
- PMCID: PMC2825257
- DOI: 10.1371/journal.pone.0009346
Unmasking chaotic attributes in time series of living cell populations
Abstract
Background: Long-range oscillations of the mammalian cell proliferation rate are commonly observed both in vivo and in vitro. Such complicated dynamics are generally the result of a combination of stochastic events and deterministic regulation. Assessing the role, if any, of chaotic regulation is difficult. However, unmasking chaotic dynamics is essential for analysis of cellular processes related to proliferation rate, including metabolic activity, telomere homeostasis, gene expression, and tumor growth.
Methodology/principal findings: Using a simple, original, nonlinear method based on return maps, we previously found a geometrical deterministic structure coordinating such fluctuations in populations of various cell types. However, nonlinearity and determinism are only necessary conditions for chaos; they do not by themselves constitute a proof of chaotic dynamics. Therefore, we used the same analytical method to analyze the oscillations of four well-known, low-dimensional, chaotic oscillators, originally designed in diverse settings and all possibly well-adapted to model the fluctuations of cell populations: the Lorenz, Rössler, Verhulst and Duffing oscillators. All four systems also display this geometrical structure, coordinating the oscillations of one or two variables of the oscillator. No such structure could be observed in periodic or stochastic fluctuations.
Conclusion/significance: Theoretical models predict various cell population dynamics, from stable through periodically oscillating to a chaotic regime. Periodic and stochastic fluctuations were first described long ago in various mammalian cells, but by contrast, chaotic regulation had not previously been evidenced. The findings with our nonlinear geometrical approach are entirely consistent with the notion that fluctuations of cell populations can be chaotically controlled.
Conflict of interest statement
Figures


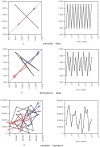
 . Left panel: Ordinate: oscillatory behavior of variables x (top) and y (bottom). Abscissa: time. Right panel: phase-space representation of the attractor.


Similar articles
-
Detection of chaotic determinism in time series from randomly forced maps.Physica D. 1997;99:471-86. doi: 10.1016/s0167-2789(96)00159-5. Physica D. 1997. PMID: 11540720
-
Stochastic models for circadian rhythms: effect of molecular noise on periodic and chaotic behaviour.C R Biol. 2003 Feb;326(2):189-203. doi: 10.1016/s1631-0691(03)00016-7. C R Biol. 2003. PMID: 12754937 Review.
-
Detection of "noisy" chaos in a time series.Methods Inf Med. 1997 Dec;36(4-5):294-7. Methods Inf Med. 1997. PMID: 9470382
-
Synchronization regimes in conjugate coupled chaotic oscillators.Chaos. 2009 Sep;19(3):033143. doi: 10.1063/1.3236385. Chaos. 2009. PMID: 19792023
-
Is there chaos in the brain? I. Concepts of nonlinear dynamics and methods of investigation.C R Acad Sci III. 2001 Sep;324(9):773-93. doi: 10.1016/s0764-4469(01)01377-4. C R Acad Sci III. 2001. PMID: 11558325 Review.
Cited by
-
Poincaré Maps and Aperiodic Oscillations in Leukemic Cell Proliferation Reveal Chaotic Dynamics.Cells. 2021 Dec 19;10(12):3584. doi: 10.3390/cells10123584. Cells. 2021. PMID: 34944093 Free PMC article.
-
Nrf1 acts as a highly-conserved determinon for maintaining robust redox homeostasis in the eco-evo-devo process of life histories.Cell Stress. 2025 Jul 7;9:65-142. doi: 10.15698/cst2025.07.306. eCollection 2025. Cell Stress. 2025. PMID: 40703332 Free PMC article. Review.
-
Can we negotiate with a tumor?PLoS One. 2014 Aug 1;9(8):e103834. doi: 10.1371/journal.pone.0103834. eCollection 2014. PLoS One. 2014. PMID: 25084359 Free PMC article.
-
Fractal dimensions of in vitro tumor cell proliferation.J Oncol. 2015;2015:698760. doi: 10.1155/2015/698760. Epub 2015 Mar 25. J Oncol. 2015. PMID: 25883653 Free PMC article.
References
-
- Khokha MK, Landini G, Iannacone PM. Fractal geometry in rat chimeras demonstrates that a repetitive cell division program may generate liver parenchyma. Dev Biol. 1994;165:545–555. - PubMed
-
- Lampl M, Jeanty P. Timing is everything: a reconsideration of fetal growth velocity patterns identifies the importance of individual and sex differences. Am J Hum Biol. 2003;15:667–680. - PubMed
-
- Franchimont C, Pierard GE, Van Cauwenberge D, Damseaux M, Lapierre CH. Episodic progression and regression of basal cell carcinomas. Br J Dermatol. 1982;106:305–310. - PubMed
-
- Maigné J, Deschatrette J, Sarrazin S, Hecquet B, Guerroui S, et al. The time-pattern of rises and falls in proliferation fades with senescence of mortal lines and is perpetuated in immortal rat hepatoma fao cell line. In Vitro Cell Dev Biol. 1998;34:163–169. - PubMed
-
- Maughan WZ, Bishop CR, Pryor TA, Athens JW. The question of cycling of the blood neutrophil concentrations and pitfalls in the statistical analysis of sampled data. Blood. 1973;41:85–91. - PubMed
MeSH terms
LinkOut - more resources
Full Text Sources

