

Mesoscopic organization reveals the constraints governing Caenorhabditis elegans nervous system
- PMID: 20179757
- PMCID: PMC2825259
- DOI: 10.1371/journal.pone.0009240
Mesoscopic organization reveals the constraints governing Caenorhabditis elegans nervous system
Abstract
One of the biggest challenges in biology is to understand how activity at the cellular level of neurons, as a result of their mutual interactions, leads to the observed behavior of an organism responding to a variety of environmental stimuli. Investigating the intermediate or mesoscopic level of organization in the nervous system is a vital step towards understanding how the integration of micro-level dynamics results in macro-level functioning. The coordination of many different co-occurring processes at this level underlies the command and control of overall network activity. In this paper, we have considered the somatic nervous system of the nematode Caenorhabditis elegans, for which the entire neuronal connectivity diagram is known. We focus on the organization of the system into modules, i.e., neuronal groups having relatively higher connection density compared to that of the overall network. We show that this mesoscopic feature cannot be explained exclusively in terms of considerations such as, optimizing for resource constraints (viz., total wiring cost) and communication efficiency (i.e., network path length). Even including information about the genetic relatedness of the cells cannot account for the observed modular structure. Comparison with other complex networks designed for efficient transport (of signals or resources) implies that neuronal networks form a distinct class. This suggests that the principal function of the network, viz., processing of sensory information resulting in appropriate motor response, may be playing a vital role in determining the connection topology. Using modular spectral analysis we make explicit the intimate relation between function and structure in the nervous system. This is further brought out by identifying functionally critical neurons purely on the basis of patterns of intra- and inter-modular connections. Our study reveals how the design of the nervous system reflects several constraints, including its key functional role as a processor of information.
Conflict of interest statement
Figures
 and
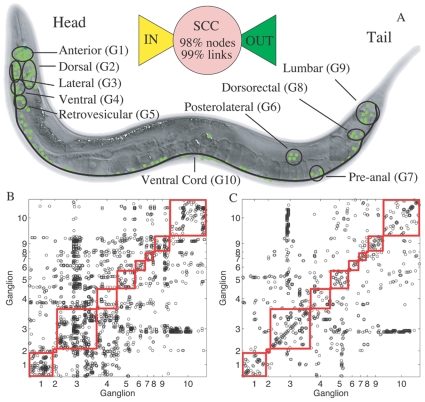
and  , respectively, of the 279 connected neurons in the somatic nervous system. (B, C) The connectivity matrix corresponding to the (B) Synaptic and (C) Gap-junctional connections between the somatic system neurons. In all figures, the partition symbols correspond to (G1) Anterior, (G2) Dorsal, (G3) Lateral, (G4) Ventral, (G5) Retrovesicular, (G6) Posterolateral, (G7) Preanal, (G8) Dorsorectal and (G9) Lumbar ganglion, and (G10) the Ventral cord.

 , as a function of the wiring cost, defined using either the “dedicated-wire” model (DW) or the “common-wire” model (CW), in the ensemble of random networks with degree sequence identical to the C. elegans neuronal network. The trend indicates a trade-off between increasing communication efficiency and decreasing wiring cost. The corresponding values for the empirical network are indicated by crosses for both DW and CW. The schematic figures shown above the main panel indicate the type of networks obtained in the limiting cases when only one of the two constraints are satisfied. In both curves, error bars indicate the standard deviations calculated for
  random realizations. We observe that the empirical network is suboptimal in terms of wiring cost and communication efficiency, suggesting the presence of other constraints governing the network organization.
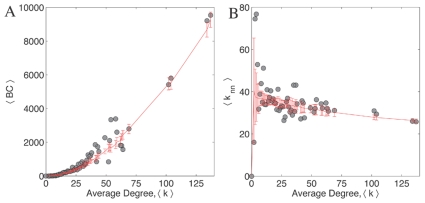
 , and (B) the average nearest neighbor degree,
  of each node as a function of its total degree,
  . Betweenness centrality is a measure of how frequently a particular node is used when a signal is being sent between any pair of nodes in the network using the shortest path. In case of the Internet, BC of nodes increases with its degree which is sought to be linked with its information transport property. In C. elegans, although BC increases with degree, this increase is not significant when compared to the randomized version of the network. In the case of the relation between the average connectivity of nearest neighbors of a node with its total degree
  , we note that for both the Internet and protein interaction network,
  decreases with
  as a power law. This means that low connectivity nodes have high degree nodes as their neighbors and vice-versa. However, in the case of C. elegans, this relation is not very apparent and insignificant in comparison with the randomized version of the network. In both figures, error bars indicate the standard deviations calculated for
  random realizations. These results suggest that the C. elegans network forms a class distinct from the class of networks optimized only for signal propagation.
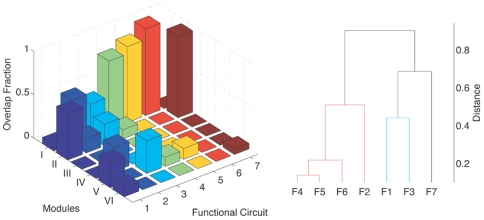

 -score of each neuron in the empirical neuronal network is shown against the corresponding participation coefficient
  . The within module degree measures the connectivity of a node to other nodes within its own module, while the participation coefficient measures its connectivity with neurons in the entire network. (B) The corresponding result for a randomized version of the C. elegans network where the degree of each neuron is kept unchanged is also shown. Neurons belonging to the different regions in the
  space are categorised as: (gray) R1: “ultraperipheral nodes”, i.e., nodes with all their links within their module, (blue) R2: “peripheral nodes”, i.e., nodes with most links within their module, (pink) R3: “nonhub connector nodes”, i.e., nodes with many links to other modules, (green) R4: “nonhub kinless nodes”, i.e., nodes with links homogeneously distributed among all modules, (yellow) R5: “provincial hubs”, i.e., hub nodes with the vast majority of links within their module, (red) R6: “connector hubs”, i.e., hubs with many links to most of the other modules, and (white) R7: “global hubs”, i.e., hubs with links homogeneously distributed among all modules. The neurons occurring as connector hubs are identified in the figure. Most of these neurons occur in different functional circuits indicating the close relation between functional importance and connectivity pattern of individual neurons. In addition, the neurons AVKL and SMBVL which are predicted to be functionally important are separately marked.
References
-
- White JG, Southgate E, Thomson JN, Brenner S. The structure of the nervous system of the nematode C. elegans. Phil Trans R Soc B. 1986;314:1–340. - PubMed
-
- Riddle DL, Blumenthal T, Meyer BJ, Priess JR, editors. C. elegans II. New York: Cold Spring Harbor Laboratory Press; 1993. - PubMed
-
- Schnabel R. Why does a nematode have an invariant cell lineage? Seminars in Cell & Developmental Biology. 1997;8:341–349. - PubMed
-
- Newman MEJ. The structure and function of complex networks. SIAM Review. 2003;45:167–256.
Publication types
MeSH terms
LinkOut - more resources
Full Text Sources
