

Human multipotent stromal cells (MSCs) increase neurogenesis and decrease atrophy of the striatum in a transgenic mouse model for Huntington's disease
- PMID: 20179764
- PMCID: PMC2825266
- DOI: 10.1371/journal.pone.0009347
Human multipotent stromal cells (MSCs) increase neurogenesis and decrease atrophy of the striatum in a transgenic mouse model for Huntington's disease
Abstract
Background: Implantation of human multipotent stromal cells from bone marrow (hMSCs) into the dentate gyrus of the hippocampus of mice was previously shown to stimulate proliferation, migration and neural differentiation of endogenous neural stem cells. We hypothesized that hMSCs would be beneficial in a mouse model of Huntington disease (HD) due to these neurogenic effects.
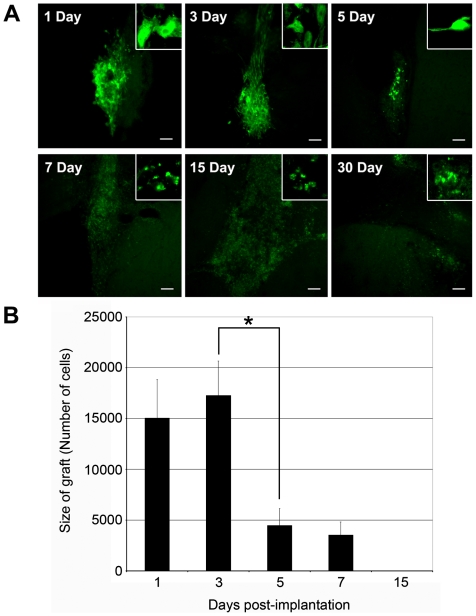
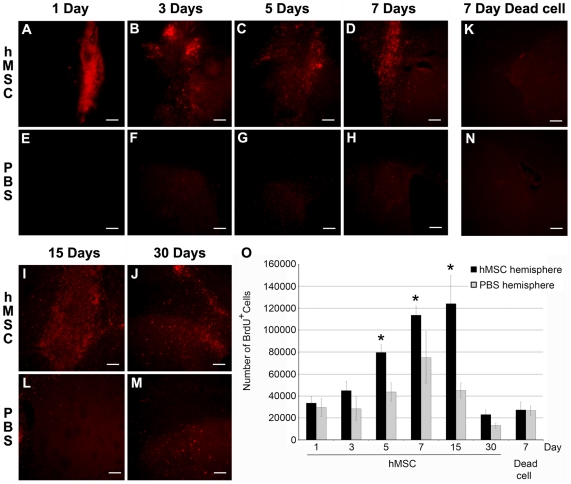
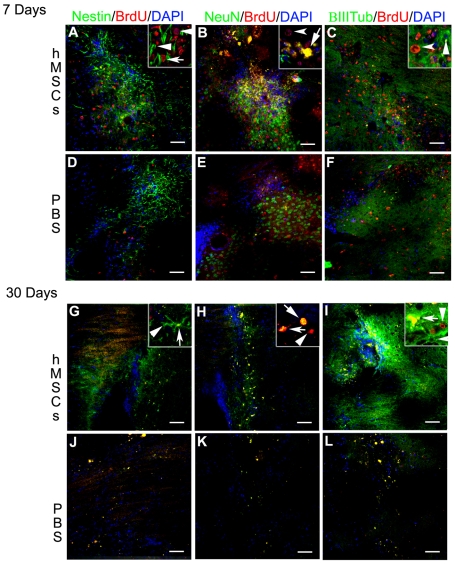
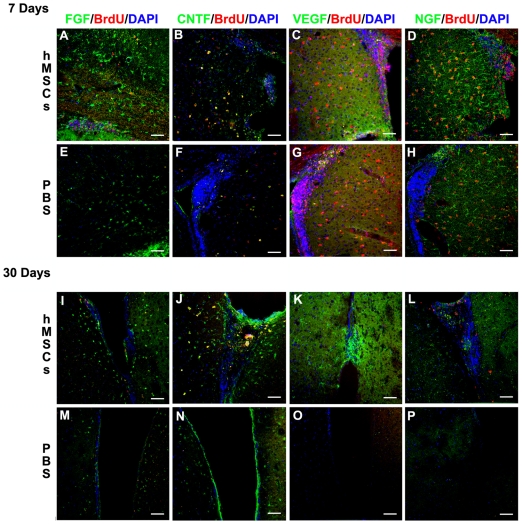
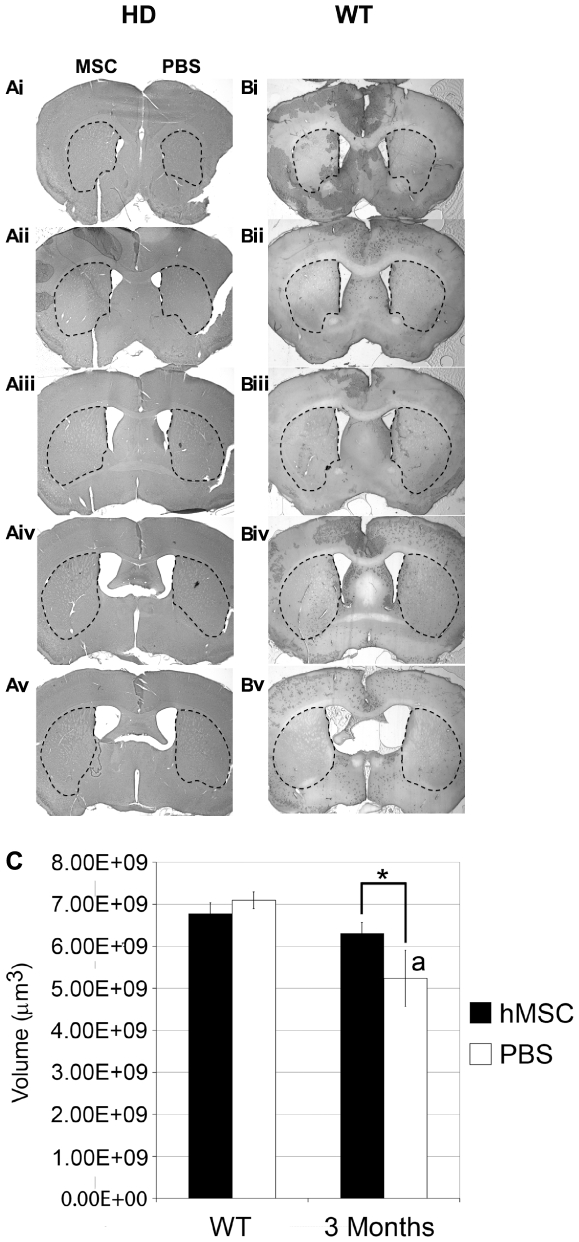
Results: We implanted hMSCs into the striatum of transgenic mice (N171-82Q) that are a model for HD. The implanted hMSCs rapidly disappeared over 3 to 15 days. However, they increased proliferation and neural differentiation of endogenous neural stem cells for up to 30 days. They also increased neurotrophic signaling and decreased atrophy of the striatum in 3-month old HD mice implanted with hMSCs one month earlier.
Conclusions: The results therefore suggested that neural implantation of hMSCs may be of benefit in HD but a number of parameters of dose, treatment schedule, and route of administration need to be optimized.
Conflict of interest statement
Figures
Similar articles
-
FGF-2 promotes neurogenesis and neuroprotection and prolongs survival in a transgenic mouse model of Huntington's disease.Proc Natl Acad Sci U S A. 2005 Dec 13;102(50):18189-94. doi: 10.1073/pnas.0506375102. Epub 2005 Dec 2. Proc Natl Acad Sci U S A. 2005. PMID: 16326808 Free PMC article.
-
Ex vivo delivery of GDNF maintains motor function and prevents neuronal loss in a transgenic mouse model of Huntington's disease.Exp Neurol. 2010 Jul;224(1):155-62. doi: 10.1016/j.expneurol.2010.03.005. Epub 2010 Mar 19. Exp Neurol. 2010. PMID: 20227407
-
Preconditioning mesenchymal stem cells with the mood stabilizers lithium and valproic acid enhances therapeutic efficacy in a mouse model of Huntington's disease.Exp Neurol. 2016 Jul;281:81-92. doi: 10.1016/j.expneurol.2016.04.003. Epub 2016 Apr 13. Exp Neurol. 2016. PMID: 27085395
-
Neurogenesis in Huntington's disease: can studying adult neurogenesis lead to the development of new therapeutic strategies?Brain Res. 2011 Aug 11;1406:84-105. doi: 10.1016/j.brainres.2011.06.040. Epub 2011 Jun 23. Brain Res. 2011. PMID: 21742312 Review.
-
Intervention of Proliferation and Differentiation of Endogenous Neural Stem Cells in the Neurodegenerative Process of Huntington's Disease Phenotype.CNS Neurol Disord Drug Targets. 2011 Jun;10(4):486-99. doi: 10.2174/187152711795563967. CNS Neurol Disord Drug Targets. 2011. PMID: 21495959 Review.
Cited by
-
Pluripotent stem cells models for Huntington's disease: prospects and challenges.J Genet Genomics. 2012 Jun 20;39(6):253-9. doi: 10.1016/j.jgg.2012.04.006. Epub 2012 May 9. J Genet Genomics. 2012. PMID: 22749012 Free PMC article. Review.
-
Human Umbilical Cord Matrix Stem Cells Reverse Oxidative Stress-Induced Cell Death and Ameliorate Motor Function and Striatal Atrophy in Rat Model of Huntington Disease.Neurotox Res. 2018 Aug;34(2):273-284. doi: 10.1007/s12640-018-9884-4. Epub 2018 Mar 8. Neurotox Res. 2018. PMID: 29520722
-
Modeling Huntington's disease with induced pluripotent stem cells.Mol Cell Neurosci. 2013 Sep;56:50-64. doi: 10.1016/j.mcn.2013.02.005. Epub 2013 Feb 28. Mol Cell Neurosci. 2013. PMID: 23459227 Free PMC article. Review.
-
Mouse models of polyglutamine diseases in therapeutic approaches: review and data table. Part II.Mol Neurobiol. 2012 Oct;46(2):430-66. doi: 10.1007/s12035-012-8316-3. Epub 2012 Sep 4. Mol Neurobiol. 2012. PMID: 22944909 Free PMC article. Review.
-
Is the Immunological Response a Bottleneck for Cell Therapy in Neurodegenerative Diseases?Front Cell Neurosci. 2020 Aug 11;14:250. doi: 10.3389/fncel.2020.00250. eCollection 2020. Front Cell Neurosci. 2020. PMID: 32848630 Free PMC article. Review.
References
-
- Vassos E, Panas M, Kladi A, Vassilopoulos D. Higher levels of extroverted hostility detected in gene carriers at risk for Huntington's disease. Biol Psychiatry. 2007;62:1347–1352. - PubMed
-
- DiFiglia M, Sapp E, Chase KO, Davies SW, Bates GP, et al. Aggregation of huntingtin in neuronal intranuclear inclusions and dystrophic neurites in brain. Science. 1997;277:1990–1993. - PubMed
-
- Myers RH, Growdon JH, Bird ED, Feldman RG, Martin JB. False-negative results with levodopa for early detection of Huntington's disease. N Engl J Med. 1982;307:561–562. - PubMed
-
- Joel D. Open interconnected model of basal ganglia-thalamocortical circuitry and its relevance to the clinical syndrome of Huntington's disease. Mov Disord. 2001;16:407–423. - PubMed
Publication types
MeSH terms
Substances
Grants and funding
LinkOut - more resources
Full Text Sources
Medical
