. 2010 Feb 12:4:8.
doi: 10.3389/neuro.05.008.2010. eCollection 2010.

Retinal afferents synapse with relay cells targeting the middle temporal area in the pulvinar and lateral geniculate nuclei

Affiliations

Retinal afferents synapse with relay cells targeting the middle temporal area in the pulvinar and lateral geniculate nuclei

Claire E Warner et al. Front Neuroanat. .

Abstract

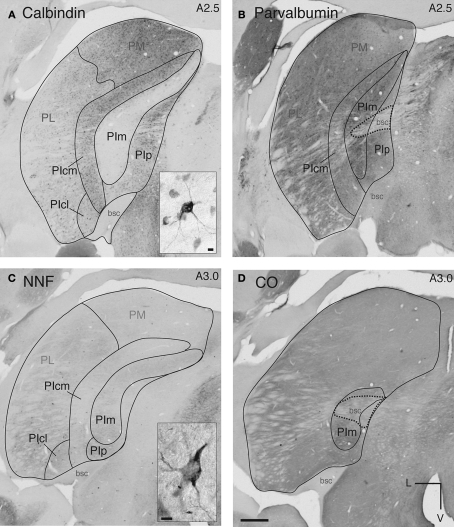
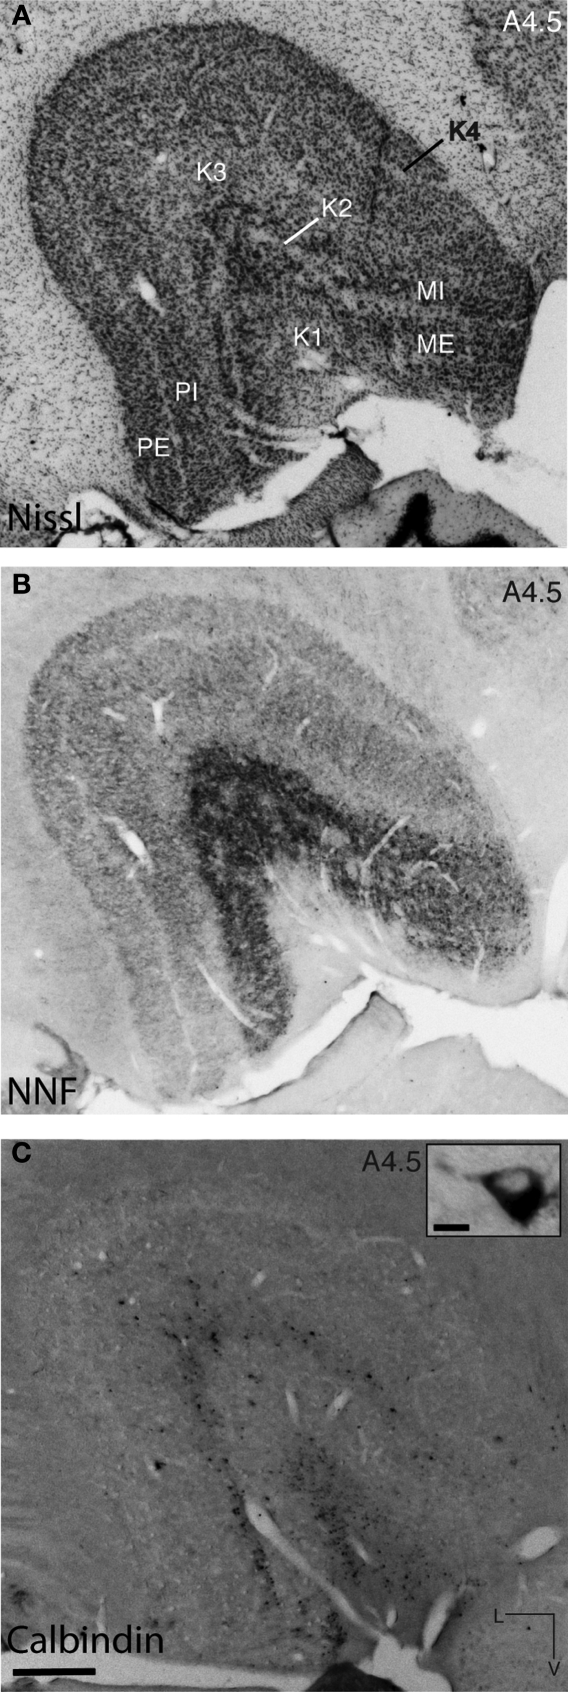
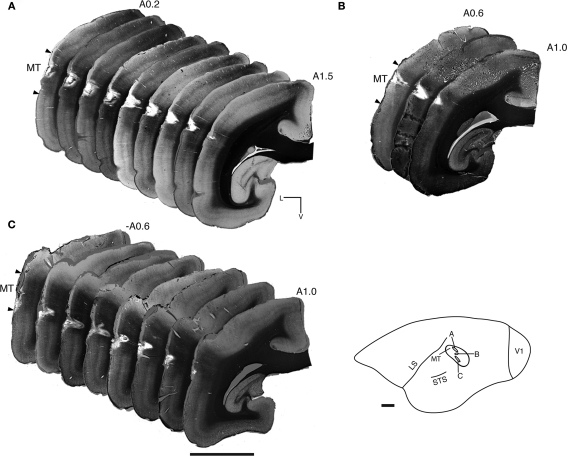
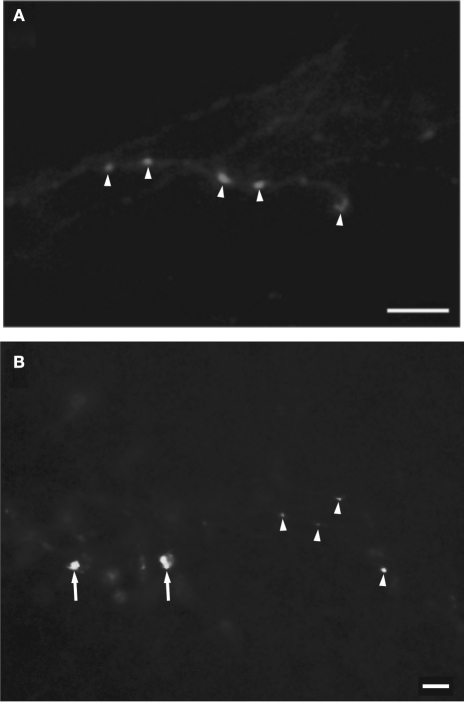
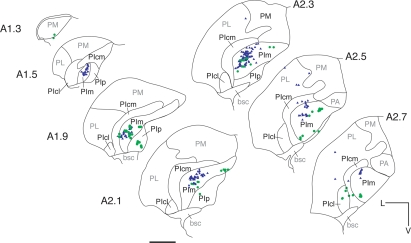
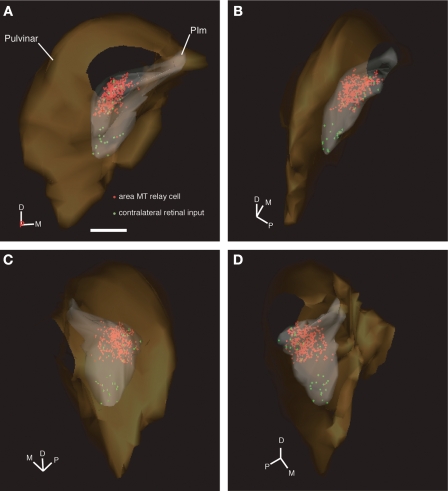
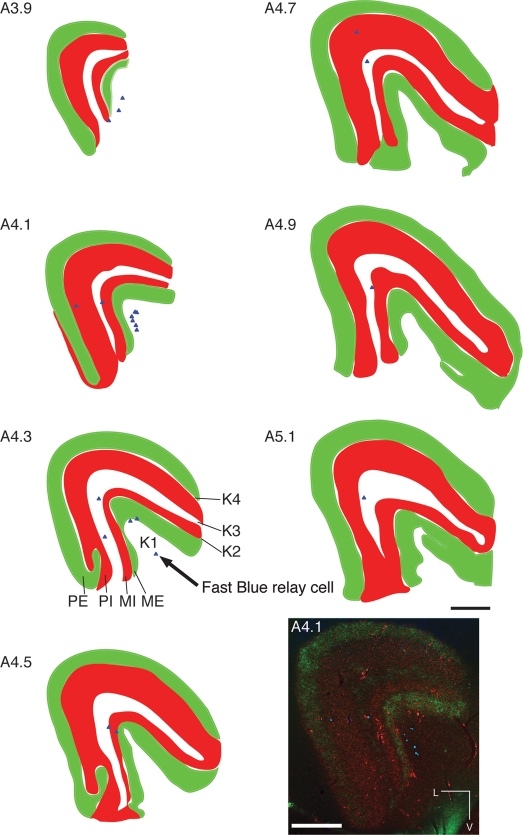
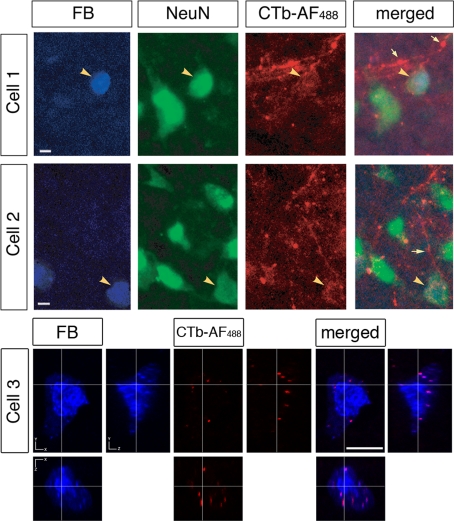
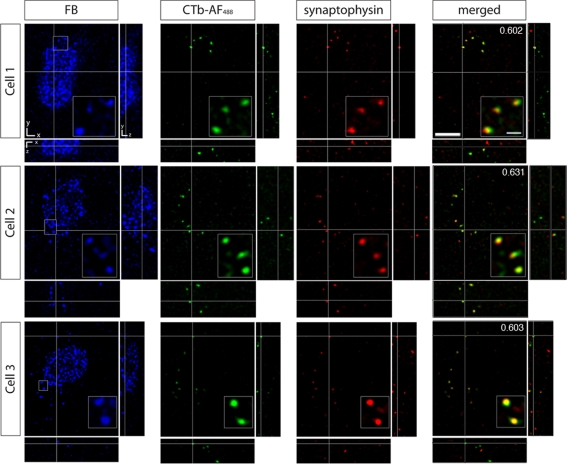
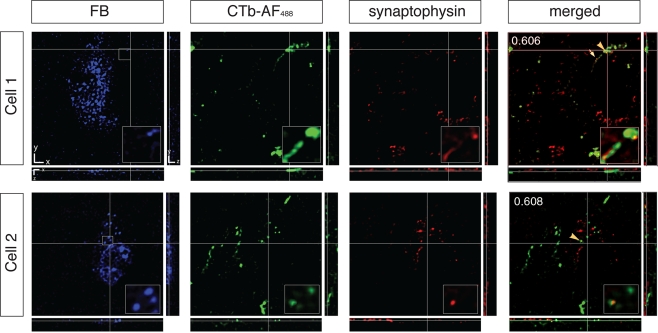
Considerable debate continues regarding thalamic inputs to the middle temporal area (MT) of the visual cortex that bypass the primary visual cortex (V1) and the role they might have in the residual visual capability following a lesion of V1. Two specific retinothalamic projections to area MT have been speculated to relay through the medial portion of the inferior pulvinar nucleus (PIm) and the koniocellular layers of the dorsal lateral geniculate nucleus (LGN). Although a number of studies have demonstrated retinal inputs to regions of the thalamus where relays to area MT have been observed, the relationship between the retinal terminals and area MT relay cells has not been established. Here we examined direct retino-recipient regions of the marmoset monkey (Callithrix jacchus) pulvinar nucleus and the LGN following binocular injections of anterograde tracer, as well as area MT relay cells in these nuclei by injection of retrograde tracer into area MT. Retinal afferents were shown to synapse with area MT relay cells as demonstrated by colocalization with the presynaptic vesicle membrane protein synaptophysin. We also established the presence of direct synapes of retinal afferents on area MT relay cells within the PIm, as well as the koniocellular K1 and K3 layers of the LGN, thereby corroborating the existence of two disynaptic pathways from the retina to area MT that bypass V1.

Keywords: V1; calcium-binding protein; extrastriate areas; neuronal tracing; nonhuman primate; synapse; synaptophysin; thalamus.


Figures

Figure 1
Figure 1
Immunohistochemical and histological staining of the marmoset pulvinar nucleus enables demarcation of subnuclei. Coronal sections at a similar A-P level (A,B: A 2.5 mm and C,D: A 3.0 mm) of the left hemisphere pulvinar nucleus (A,B: CJ59, C,D: NM32) processed with different histological and immunohistochemical techniques. Demarcations have been included where it was possible to identify these with each stain. (A) Section of pulvinar nucleus reacted with the antibody to calbindin-D28k showing a lack of immunoreactivity in PIm surrounded laterally by a more intensely stained (cells and neuropil) PIcm. Medially located PIp has light neuropil and dark cells that are less densely stained than those of PIcm. Ventrolateral to PIcm is PIcl which has darker neuropil and sparse small dark cells. Lateral to PIcl and PIcm is PL, most of which stains lightly for neuropil and cells with the exception of the dorsomedial part that has slightly increased staining in cells. Inset: Also present in PL, PIcl and PIcm are large intensely stained cells, the majority residing ventrally. Dorsal to PI and PL lies PM with moderate staining of neuropil and small dark cells. (B) Section of pulvinar nucleus adjacent to (A) reacted for parvalbumin showing a complementary reaction pattern to that observed for calbindin-D28k. PIm is more heavily immunostained than PIcm and PIp. Due to the darkness of the neuropil immunostaining the brachium of the superior colliculus can easily be seen bisecting the pulvinar nucleus. (C) Section of pulvinar nucleus reacted with NNF antibody, showing moderate immunostaining of PIm, an absence of immunostaining in the PIcm and very light NNF immunostaining of PM. Neuropil was immunostained in the PIcl and was slightly darker in the PL (ventrolateral portion of PL is darkest). Inset: Neurofilament expression in perikaryon and dendrites of large dark NNF-immunopositive cells in PL, PIcl and PIcm. (D) Section of pulvinar nucleus stained for cytochrome oxidase showing a dark stained PIm, with no reactivity in the brachium of the superior colliculus similar to the parvalbumin antigen-free region of the brachium of the superior colliculus in (B). All four protocols were used to demarcate the subdivisions of the pulvinar nucleus for the purposes of digitizing and the overlay of retinal afferents and area MT relay cells. L, lateral; V, ventral; scale bar = 500 μm, inset scale bar = 10 μm.
Figure 2
Figure 2
Photomicrographs of adjacent coronal sections of the marmoset LGN processed with different histological and immunohistochemical stains enable demarcation of the magnocellular, parvocellular and koniocellular layers. (A) Section stained with cresyl violet (Nissl bodies) revealing the large cells of the magnocellular layers (MI and ME) and the smaller cells in the two parvocellular layers (PI and PE). (B) Immunostaining for NNF shows an increase in reactivity in both cells and neuropil in the magnocellular layers compared with the parvocellular layers, making them clearly discernible. In both the Nissl substance and NNF stains, it is difficult to discern the discrete koniocellular (K1-4) layers, but staining with an antibody for calbindin-D28k (C) reveals these layers. Inset: Calbindin-D28k-immunoreactive cell in layer K3 of the LGN. All three protocols were used to demarcate the laminar borders in the LGN for the purposes of digitizing and the overlay of retinal afferents and area MT relay cells. L, lateral; V, ventral; scale bar = 500 μm, inset scale bar = 10 μm.
Figure 3
Figure 3
Myelin-stained coronal sections enables identification of area MT and ensures accurate placement of Fast Blue injections. (A) NM53 A0.2–1.5 mm, crystal insertion. (B) NM55 A0.6–1.0 mm, micropipette injection. (C) NM58 A0.6–1.0 mm, crystal insertion. These montages confirm the correct placement of the Fast Blue in cortical area MT in all three cases, and also confirm that the injection/crystal placement has not impeded upon the white matter. The location of injection sites mapped out on the lateral surface of area MT for each case studied can be seen in the inset, revealing the varied topographical placement of each. LS, lateral sulcus; STS, superior temporal sulcus; L, lateral; V, ventral. Scale bar = 3 mm.
Figure 4
Figure 4
Representative examples of the morphology of target-specific retinal terminal fields from the contralateral eye seen in the medial portion of the inferior pulvinar nucleus (PIm) (A) and LGN (K1 layer) (B) of the left hemisphere. Retinal terminal fields seen in the PIm have thin axons with small sized varicosities (arrow heads) resembling beads on a string. In the K1 layer of the LGN the terminal fields are seen to have thick axons with large varicosities (arrows) as well as medium caliber axons with well-spaced medium varicosities (arrow heads). Scale bar = 5 μm in (A) and scale bar = 10 μm in (B).
Figure 5
Figure 5
Distribution of retinal afferent terminals and labeled area MT relay cells in the pulvinar nucleus of the left hemisphere. Digitized line drawings of the pulvinar nucleus and its subdivisions in coronal sections (Case NM55; 200 μm interval) demonstrating the distribution of area MT retrogradely labeled cell bodies (blue triangles) and contralateral retinal terminals (green dots) identified as varicosities along labeled axons. Area MT relay cells are mainly clustered in the PIm away from its ventral border and closer to the PIcm. Retinal input, although sparse, was also restricted principally to the PIm, with two separate zones of terminals being observed in the dorsal and ventral region of the PIm. Sections are presented in sequence along the anteroposterior axis, starting at the most posterior end (A 1.3 mm) to the most anterior section (A 2.7 mm). Adjacent sections immunostained for calbindin-D28k were used to delimit pulvinar subnuclei. L, lateral; V, ventral; scale bar = 1 mm.
Figure 6
Figure 6
3D model of the pulvinar nucleus (left hemisphere) constructed from digitized line drawings (Case NM55; 200 μm interval) demonstrating the holistic distribution of retinal afferent terminals and area MT relay cells. In the PIm subnucleus (gray) of the pulvinar nucleus (orange), the distribution of retrograde labeled area MT relay cells (red) and contralateral retinal terminals (identified as varicosities along labeled axons, green), are easily observed. The 3D perspective enables enhanced identification of the sparse retinal input and colocalization with the area MT relay cells, especially in the dorsomedial portion of the PIm. 3D model is rotated anticlockwise in the horizontal plane, i.e. looking from above down onto the model. (A) zero degrees, posterior coming out of screen, (B) 60 degrees, (C) 135 degrees and (D) 300 degrees. D, dorsal; M, medial; P, posterior; scale bar = 1 mm. A movie of the pulvinar nucleus model can be found in Supplementary Material.
Figure 7
Figure 7
Distribution of labeled area MT relay cells throughout the layers of the left LGN. Digitized line drawings of the LGN and its layers in coronal sections (Case NM58; 200 μm interval), demonstrating the distribution of ipsilateral (dark red) and contralateral (light green) terminal fields in the magnocellular and parvocellular and koniocellular layers (white) in addition to the area MT relay cells (blue triangles), seen primarily in the medial sections of the LGN and in the koniocellular layers (K1 and K3). Sections are presented in sequence along the anteroposterior axis from at the most posterior (A 3.9 mm) to the most anterior section (A 5.1 mm). Anteroposterior level 4.1 is reproduced at the bottom right to illustrate the pattern of labeling seen in the LGN used to create the line drawings. Adjacent sections reacted for calbindin-D28k, NNF and Nissl substance were used to delimit the LGN laminae. L, lateral; V, ventral; scale bar = 500 μm.
Figure 8
Figure 8
Evidence of contralateral retinal afferent terminals surrounding area MT relay cells in the medial portion of the inferior pulvinar nucleus (PIm). Using standard epifluorescence microscopy, we demonstrate two representative cells (Cell 1 and Cell 2) from different sections to reveal the existence of area MT relay cells in the PIm of the pulvinar nucleus, which are confirmed as cell bodies by colabeling with the neuron-specific nuclear stain NeuN [pseudocolored green for better visibility of overlap with Fast Blue (FB) labeling]. These cell bodies were then observed to be colocalized with terminals of the contralateral retinal afferents labeled with CTb-AF488 (pseudocolored red) surrounding the periphery of the cell bodies. Large arrowheads point to an area MT relay cell surrounded by ‘bouton-like’ terminals. Small arrows indicate en passage retinal axons proximal to area MT relay cells, representative of the type of axonal fiber observed in the PIm (thin axon with small varicosities). Using confocal microscopy we are able to further demonstrate the colocalization of contralateral retinal terminals with an area MT-projecting cell (Cell 3). Cell 1 and 2 scale bar = 5 μm, cell3 scale bar = 10 μm.
Figure 9
Figure 9
Confocal micrographs of three area MT relay cells in the left hemisphere pulvinar nucleus (PIm) surrounded by retinal terminals from contralateral retinal afferents colocalized with synaptophysin. In PIm, contralateral retinal terminals (green) synapse onto the cell bodies of Fast Blue-labeled area MT relay cells as confirmed by colocalization with synaptophysin (red) resulting in overlapping (yellow) puncta. Overlapping puncta was seen to be concentrated at one end of the cell (Cell 1) and surrounding the cell body. In this example, area MT of the left hemisphere was labeled with Fast Blue and the right eye was labeled with CTb-AF488. Values in the top right hand corner of the merged images indicate Pearson's coefficient for synaptophysin and contralateral retina input as calculated by Costes’ method (see Materials and Methods). The merged image only shows the overlay of the anterograde label and the synaptophysin immunofluorescence to better visualize their colocalization. Scale bar = 5 μm. Insets: 3× magnification of selected area outlined by small box in the FB image of each cell. Scale bar = 2 μm.
Figure 10
Figure 10
Confocal micrographs of two area MT relay cells from layers K1 and K3 of the left hemisphere LGN associated with contralateral retinal input colocalized with synaptophysin. Blue images correspond to Fast Blue (FB)-labeled area MT relay cells, retinal input from the right eye labeled with CTb-AF488 and red images to synaptophysin. Right panels are merged images (FB + CTb-AF488 + synaptophysin). Large and medium sized boutons are colocalized (arrowheads) with synaptophysin proximal to FB-labeled cells. Cell 1 has a large bouton sending a fine axon (small arrow) to the cell body. From the top right hand corner of Cell 2, axons are seen to travel towards the area MT relay cell body where they synapse. Values in the top right hand corner of the merged image indicate Pearson's coefficient for synaptophysin and contralateral retina input as calculated by Costes’ method (see Materials and Methods). The merged image only shows the overlay of the anterograde label and the synaptophysin immunofluorescence to better visualize their colocalization. Scale bar = 5 μm. Insets: 3× magnification of selected area outlined by small box in the FB image of each cell. Scale bar = 2 μm.

Similar articles

Cited by

References

    1. Adams M. M., Hof P. R., Gattass R., Webster M. J., Ungerleider L. G. (2000). Visual cortical projections and chemoarchitecture of macaque monkey pulvinar. J. Comp. Neurol. 419, 377–39310.1002/(SICI)1096-9861(20000410)419:3<377::AID-CNE9>3.0.CO;2-E - DOI - PubMed
    1. Angelucci A., Clasca F., Sur M. (1996). Anterograde axonal tracing with the subunit B of cholera toxin: a highly sensitive immunohistochemical protocol for revealing fine axonal morphology in adult and neonatal brains. J. Neurosci. Methods 65, 101–11210.1016/0165-0270(95)00155-7 - DOI - PubMed
    1. Azzopardi P., Fallah M., Gross C. G., Rodman H. R. (2003). Response latencies of neurons in visual areas MT and MST of monkeys with striate cortex lesions. Neuropsychologia 41, 1738–175610.1016/S0028-3932(03)00176-3 - DOI - PubMed
    1. Barbur J. L., Watson J. D., Frackowiak R. S., Zeki S. (1993). Conscious visual perception without V1. Brain 116, 1293–130210.1093/brain/116.6.1293 - DOI - PubMed
    1. Beckers G., Zeki S. (1995). The consequences of inactivating areas V1 and V5 on visual motion perception. Brain 118, 49–6010.1093/brain/118.1.49 - DOI - PubMed

LinkOut - more resources