Review
. 2010 Mar;39(3):912-22.
doi: 10.1039/b822556g. Epub 2010 Jan 4.

Nanofluidic concentration devices for biomolecules utilizing ion concentration polarization: theory, fabrication, and applications

Affiliations
Review

Nanofluidic concentration devices for biomolecules utilizing ion concentration polarization: theory, fabrication, and applications

Sung Jae Kim et al. Chem Soc Rev. 2010 Mar.

Abstract

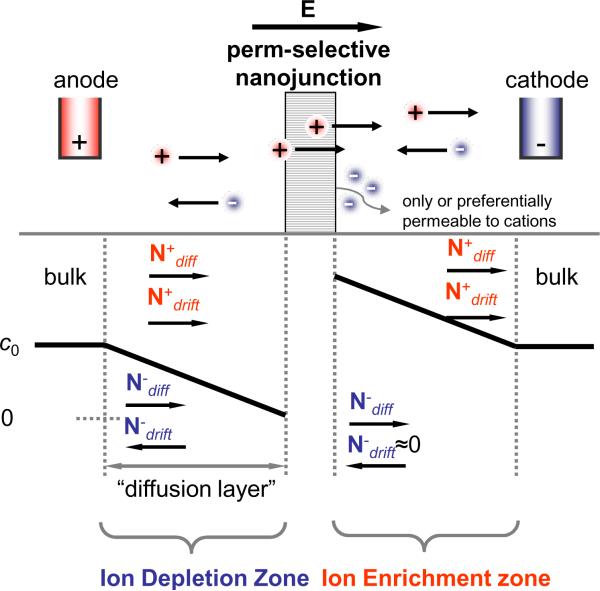
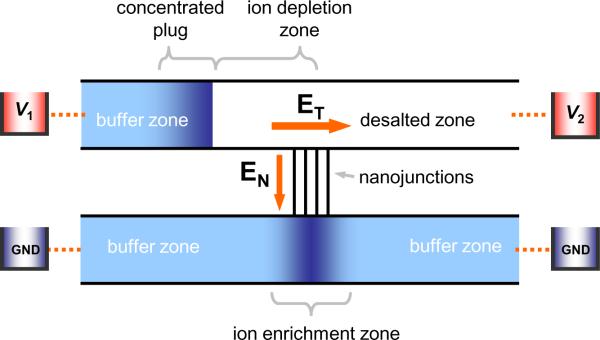
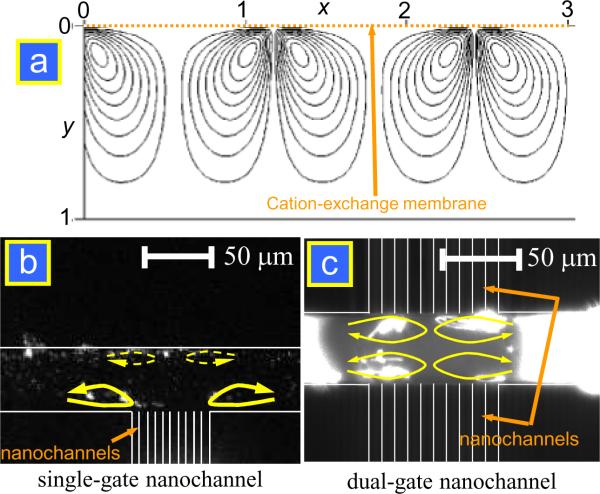
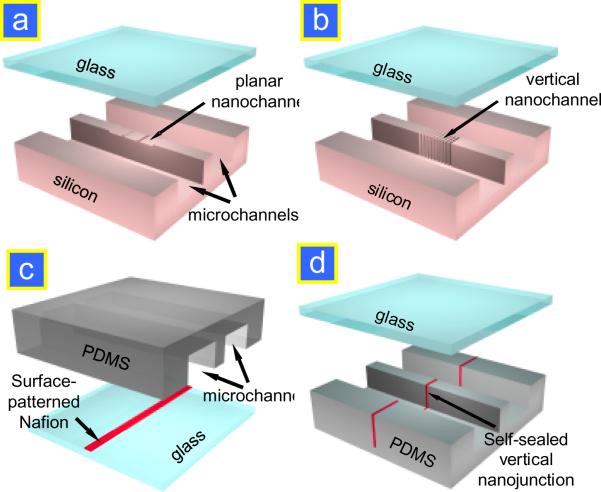
Recently, a new type of electrokinetic concentration devices has been developed in a microfluidic chip format, which allows efficient trapping and concentration of biomolecules by utilizing ion concentration polarization near nanofluidic structures. These devices have drawn much attention not only due to their potential application in biomolecule sensing, but also due to the rich scientific content related to ion concentration polarization, the underlying physical phenomenon for the operation of these electrokinetic concentration devices. This tutorial review provides an introduction to the scientific and engineering advances achieved, in-depth discussion about several interesting applications of these unique concentration devices, and their current limitations and challenges.


Figures

Figure 1
Figure 1
Schematic diagram of ion concentration distribution at the front and back of a cation perm-selective nanostructure which only lets cations pass through. N+ and N are the fluxes of cation and anion, respectively, and the subscripts diff and drift represent the diffusive and drift ion transport, respectively. E is the applied electric field across the membrane.
Figure 2
Figure 2
Schematic diagram of a single-gated electrokinetic concentrator in a typical micro/nanofluidic hybrid channel system and electrical configurations under dc bias.
Figure 3
Figure 3
(a) Mathematically calculated steady state streamline near perm-selective membrane located at y = 0. (b) Snapshots of tracer particles at different applied voltages showing quasi-steady state streamlines near cation-exchange membrane. (c) Fast vortices in single-gated micro/nanofluidic device. (d) Since the ions were depleted through nanochannels on both sides, four independent vortices were formed in the four divided regions in a dual-gated device. Reprinted with permission from (a) ref. 22, (b) ref. 24 and (c), (d) ref.10.
Figure 4
Figure 4
Available techniques for fabricating perm-selective nanojunctions. (a) Planar nanochannel fabrication in Si/glass. (b) Vertical nanochannels in Si. (c) Surface-patterned Nafion junction. (d) Self-sealed Nafion junction.
Figure 5
Figure 5
Schematic diagram of the (a) device fabrication and (b) nanofluidic biomolecule concentrator. For the device fabrication, only standard lithography was required. A nanoscale channel depth down to 20 nm can be fabricated and sealed by anodic bonding without collapsing. (c) The dual-gated preconcentrator chip in silicon-glass.
Figure 6
Figure 6
(a) Schematic diagram of fabricating vertical nanochannels: (i) photolithography defines pattern structures; (ii) vertical trenches with smooth sidewalls are etched by either DRIE or anisotropic wet etching (KOH); (iii) thermal oxide growth further decreases the gap size; (iv) uniform PECVD oxide is deposited to seal narrow trenches; (v) backside etching of the Si wafer yields thin membranes over a wide area (~6 inch wafers). (b) Cross-sectional SEM micrographs of slot-like vertical nanochannels with a uniform gap size of 72 nm and 55 nm. The channels are etched by KOH etching and have a depth of 28 μm. The channels are completely sealed by depositing 3 μm thick PECVD oxide.
Figure 7
Figure 7
(a) Schematic of the micro flow patterning and micro contact printing techniques to pattern a planar Nafion membrane on a glass substrate. (b) PDMS preconcentrator chip with surface-patterned ion-selective membrane. (c) Preconcentration of β-phycoerythrin versus electrokinetic trapping time. This result shows that one can achieve a preconcentration factor of ~105 in 20 min. Fluorescence images of 4 nM protein shown next to the graph prove an increase in the concentrated plug in size and concentration with trapping time.
Figure 8
Figure 8
(a) Integration concept of bead-based assay and nanofluidic preconcentrator. Trapped beads at the weir structure in front of the nanochannels. (b) Immunosensing without and with preconcentration in a nanofluidic bead-based assay. The enhanced signals (bound RPE on the beads) were not affected by the additional washing/flushing step, clearly demonstrating the enhanced binding by the preconcentration step.
Figure 9
Figure 9
(a) Scheme and product profile from the enzyme–substrate reaction, showing the enhancement of enzyme–substrate turnover rate at the concentrated zone generated by nanofluidic electrokinetic trapping. When preconcentration operated, enzyme as well as substrate is concentrated near the nanochannel (zone 2), consequently enhancing the reaction kinetics of a low abundant enzyme. Zone 1 indicates the reaction in a microchannel in the zone far from the concentrating zone. The difference in fluorescence signals from zone 1 and 2 means enhancing enzyme activity by the preconcentrating operation. Zone 3 illustrates the depletion zone, showing the control experiments for eliminating background noise that can be generated from the adsorption of enzyme/substrate. (b) Fluorescence intensity of products with the preconcentration operation, showing the enhancement of the trypsin catalyzed reaction with preconcentration. Reprinted with permission from ref.35.
Figure 10
Figure 10
(a) Microencapsulation of molecules with variable concentration is realized by combining an electrokinetic preconcentrator with droplet generation in immiscible fluid via a T-junction. (b) This sequence demonstrates how the concentrated FITC sample was encapsulated in immiscible fluid: 1. electrokinetic trapping of the sample in the preconcentrator at Vhigh = 500 V; 2. the release of the concentrated plug after 5 min preconcentration; 3. the concentrated sample is being injected into the immiscible mineral oil with the pressure-driven flow via a T-junction; 4. the sample plug is completely encapsulated in the droplet; 5. break-off of the droplet from the T-junction; 6. dispersion-free transport of the concentrated sample plug along the microchannel. Reprinted with permission from ref.38.

Similar articles

Cited by

References

    1. Singh AK, Throckmorton DJ, Kirby BJ, Thompson AP. Micro Total Analysis Systems. Vol. 1. Kluwer Academic; Nara, Japan: 2002. pp. 347–349.
    1. Foote RS, Khandurina J, Jacobson SC, Ramsey JM. Anal. Chem. 2005;77:57–63. - PubMed
    1. Wang Y-C, Stevens AL, Han J. Anal. Chem. 2005;77:4293–4299. - PubMed
    1. Lichtenberg J, Verpoorte E, Rooij N. F. d. Electrophoresis. 2001;22:258–271. - PubMed
    1. Cui H, Horiuchi K, Dutta P, Ivory CF. Anal. Chem. 2005;77:7878–7886. - PubMed

Publication types

MeSH terms