

Minocycline chelates Ca2+, binds to membranes, and depolarizes mitochondria by formation of Ca2+-dependent ion channels
- PMID: 20180001
- PMCID: PMC2875795
- DOI: 10.1007/s10863-010-9271-1
Minocycline chelates Ca2+, binds to membranes, and depolarizes mitochondria by formation of Ca2+-dependent ion channels
Abstract
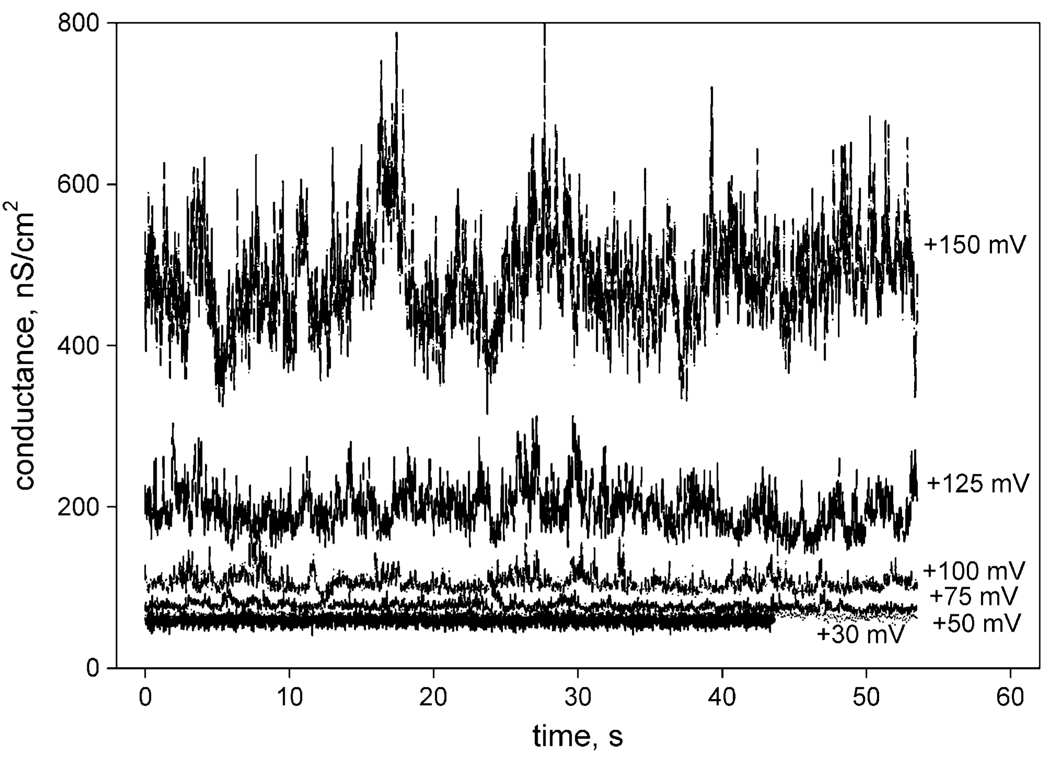
Minocycline (an anti-inflammatory drug approved by the FDA) has been reported to be effective in mouse models of amyotrophic lateral sclerosis and Huntington disease. It has been suggested that the beneficial effects of minocycline are related to its ability to influence mitochondrial functioning. We tested the hypothesis that minocycline directly inhibits the Ca(2+)-induced permeability transition in rat liver mitochondria. Our data show that minocycline does not directly inhibit the mitochondrial permeability transition. However, minocycline has multiple effects on mitochondrial functioning. First, this drug chelates Ca(2+) ions. Secondly, minocycline, in a Ca(2+)-dependent manner, binds to mitochondrial membranes. Thirdly, minocycline decreases the proton-motive force by forming ion channels in the inner mitochondrial membrane. Channel formation was confirmed with two bilayer lipid membrane models. We show that minocycline, in the presence of Ca(2+), induces selective permeability for small ions. We suggest that the beneficial action of minocycline is related to the Ca(2+)-dependent partial uncoupling of mitochondria, which indirectly prevents induction of the mitochondrial permeability transition.
Figures


Similar articles
-
Minocycline exerts uncoupling and inhibiting effects on mitochondrial respiration through adenine nucleotide translocase inhibition.Pharmacol Res. 2012 Jan;65(1):120-8. doi: 10.1016/j.phrs.2011.08.007. Epub 2011 Aug 22. Pharmacol Res. 2012. PMID: 21884796
-
[Nitric oxide as a possible regulator of energy-dependent Ca2+ transport in mitochondria of uterine smooth muscle].Fiziol Zh (1994). 2014;60(2):12-7. Fiziol Zh (1994). 2014. PMID: 25007515 Ukrainian.
-
Ferutinin Induces Membrane Depolarization, Permeability Transition Pore Formation, and Respiration Uncoupling in Isolated Rat Liver Mitochondria by Stimulation of Ca2+-Permeability.J Membr Biol. 2018 Aug;251(4):563-572. doi: 10.1007/s00232-018-0032-0. Epub 2018 Mar 28. J Membr Biol. 2018. PMID: 29594529
-
Mitochondrial Ca2+ Transport: Mechanisms, Molecular Structures, and Role in Cells.Biochemistry (Mosc). 2019 Jun;84(6):593-607. doi: 10.1134/S0006297919060026. Biochemistry (Mosc). 2019. PMID: 31238859 Review.
-
Mitochondrial calcium channels.FEBS Lett. 2010 May 17;584(10):1975-81. doi: 10.1016/j.febslet.2010.04.017. Epub 2010 Apr 11. FEBS Lett. 2010. PMID: 20388514 Review.
Cited by
-
Acute minocycline treatment mitigates the symptoms of mild blast-induced traumatic brain injury.Front Neurol. 2012 Jul 16;3:111. doi: 10.3389/fneur.2012.00111. eCollection 2012. Front Neurol. 2012. PMID: 22811676 Free PMC article.
-
Cell Death Pathways: a Novel Therapeutic Approach for Neuroscientists.Mol Neurobiol. 2018 Jul;55(7):5767-5786. doi: 10.1007/s12035-017-0793-y. Epub 2017 Oct 19. Mol Neurobiol. 2018. PMID: 29052145 Free PMC article. Review.
-
Neuroinflammation Involving Endothelin-1 and Platelet-Activating Factor Receptors Contributes To Self-Injurious Behaviors Induced by Bay k-8644 in Adolescent Mice.Neurochem Res. 2025 Apr 12;50(2):141. doi: 10.1007/s11064-025-04387-x. Neurochem Res. 2025. PMID: 40220052
-
Minocycline attenuates colistin-induced neurotoxicity via suppression of apoptosis, mitochondrial dysfunction and oxidative stress.J Antimicrob Chemother. 2017 Jun 1;72(6):1635-1645. doi: 10.1093/jac/dkx037. J Antimicrob Chemother. 2017. PMID: 28204513 Free PMC article.
-
Prospects for minocycline neuroprotection.Arch Neurol. 2010 Dec;67(12):1442-8. doi: 10.1001/archneurol.2010.191. Epub 2010 Aug 9. Arch Neurol. 2010. PMID: 20697034 Free PMC article. Review.
References
-
- Castanares M, Vera Y, Erkkila K, Kyttanen S, Lue Y, Dunkel L, Wang C, Swerdloff RS, Hikim AP. Biochem Biophys Res Commun. 2005;337:663–669. - PubMed
-
- Chen Y, Schindler M, Simon SM. J Biol Chem. 1999;274:18364–18373. - PubMed
-
- Cornet S, Spinnewyn B, Delaflotte S, Charnet C, Roubert V, Favre C, Hider H, Chabrier PE, Auguet M. Eur J Pharmacol. 2004;505:111–119. - PubMed
-
- Feigin AM, Aronov EV, Teeter JH, Brand JG. Biochim Biophys Acta. 1995;1234:43–51. - PubMed
Publication types
MeSH terms
Substances
Grants and funding
LinkOut - more resources
Full Text Sources
Miscellaneous
