

Homodimerization of the p51 subunit of HIV-1 reverse transcriptase
- PMID: 20180596
- PMCID: PMC5590755
- DOI: 10.1021/bi902116z
Homodimerization of the p51 subunit of HIV-1 reverse transcriptase
Abstract
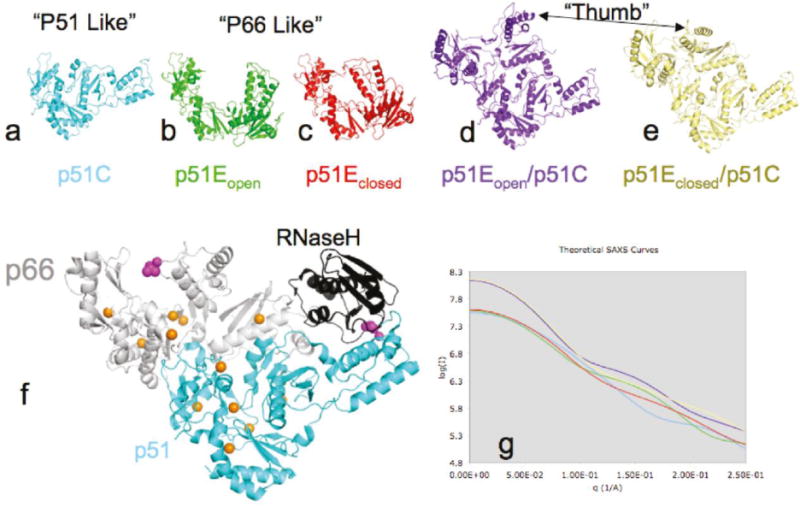
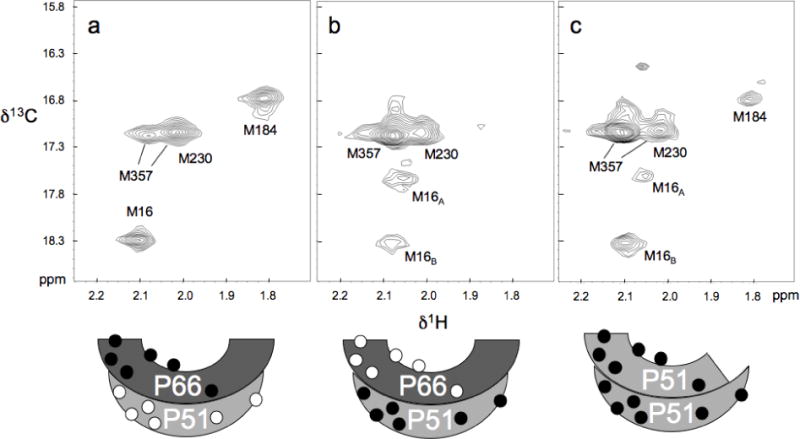
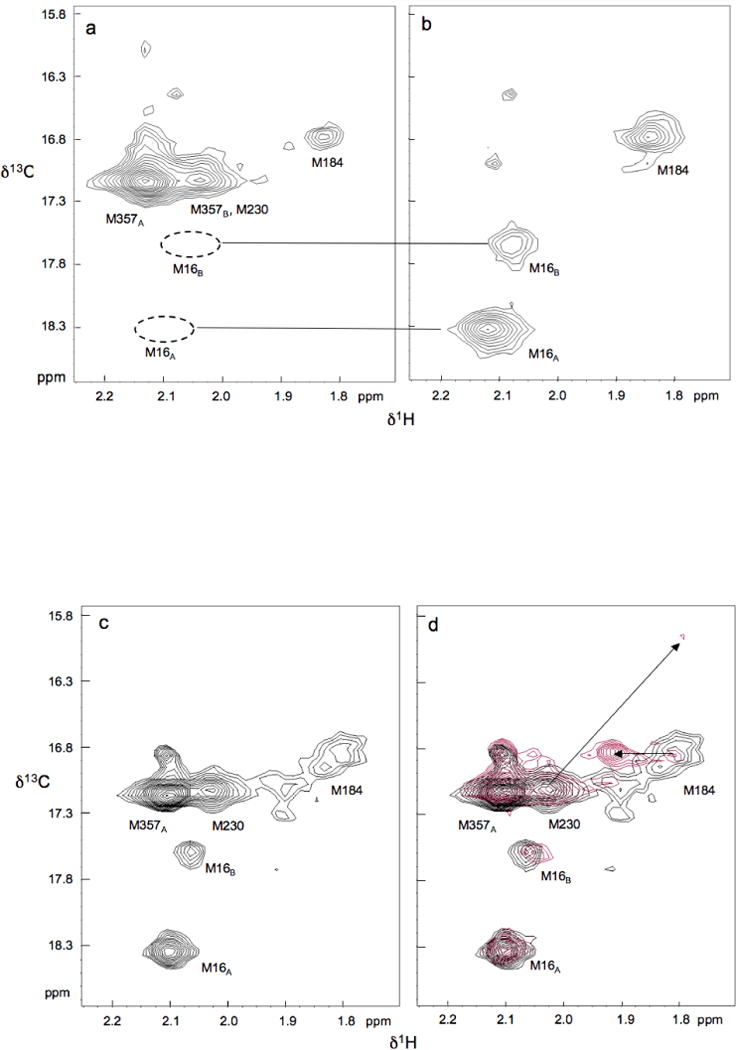
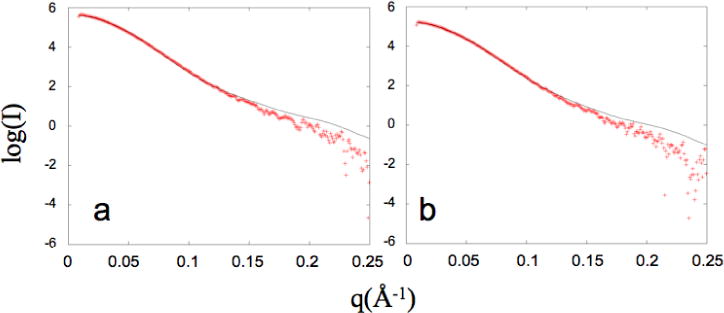
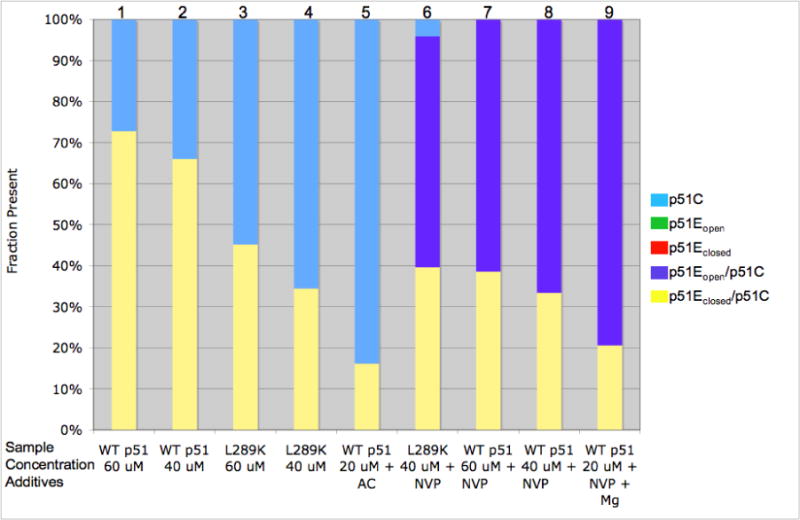
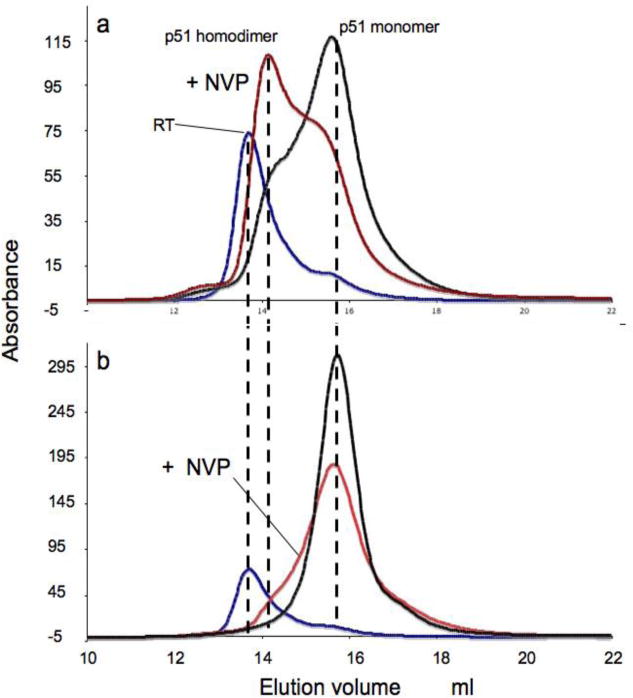
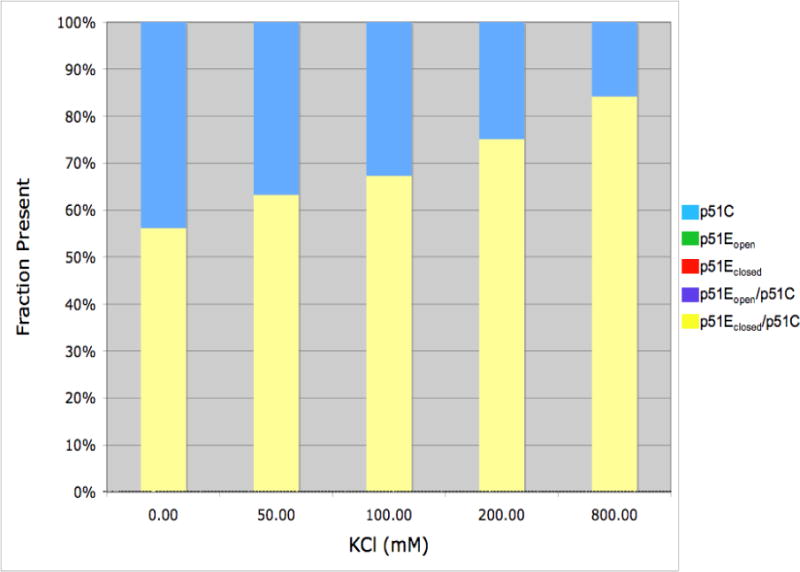
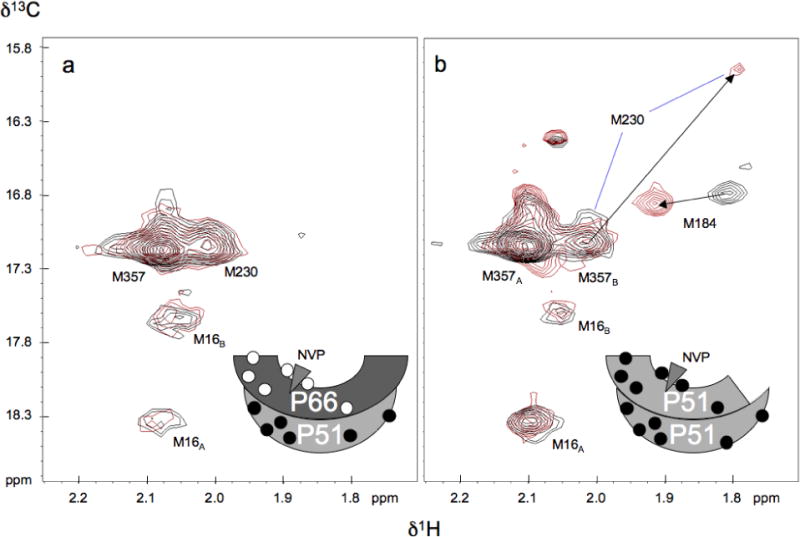
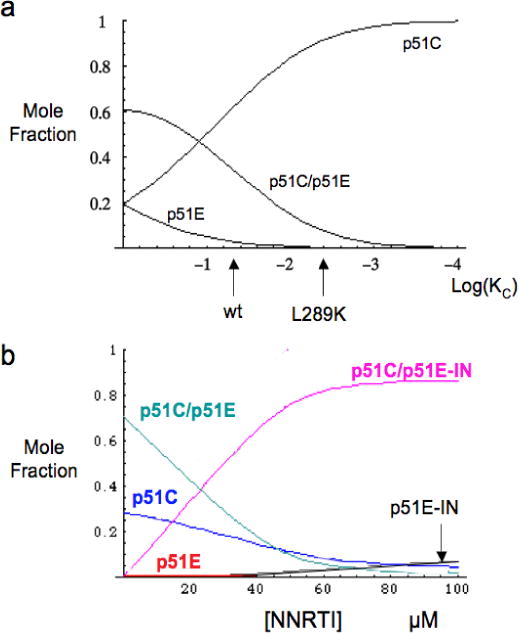
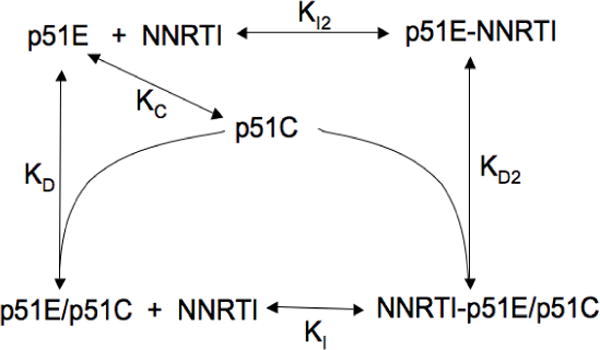
The dimerization of HIV reverse transcriptase (RT), required to obtain the active form of the enzyme, is influenced by mutations, non-nucleoside reverse transcriptase inhibitors (NNRTIs), nucleotide substrates, Mg ions, temperature, and specifically designed dimerization inhibitors. In this study, we have utilized nuclear magnetic resonance (NMR) spectroscopy of the [methyl-(13)C]methionine-labeled enzyme and small-angle X-ray scattering (SAXS) to investigate how several of these factors influence the dimerization behavior of the p51 subunit. The (1)H-(13)C HSQC spectrum of p51 obtained at micromolar concentrations indicates that a significant fraction of the p51 adopts a "p66-like" conformation. SAXS data obtained for p51 samples were used to determine the fractions of monomer and dimer in the sample and to evaluate the conformation of the fingers/thumb subdomain. All of the p51 monomer observed was found to adopt the compact, "p51C" conformation observed for the p51 subunit in the RT heterodimer. The NMR and SAXS data indicate that the p51 homodimer adopts a structure that is similar to the p66/p51 heterodimer, with one p51C subunit and a second p51 subunit in an extended, "p51E" conformation that resembles the p66 subunit of the heterodimer. The fractional dimer concentration and the fingers/thumb orientation are found to depend strongly on the experimental conditions and exhibit a qualitative dependence on nevirapine and ionic strength (KCl) that is similar to the behavior reported for the heterodimer and the p66 homodimer. The L289K mutation interferes with p51 homodimer formation as it does with formation of the heterodimer, despite its location far from the dimer interface. This effect is readily interpreted in terms of a conformational selection model, in which p51(L289K) has a much greater preference for the compact, p51C conformation. A reduced level of dimer formation then results from the reduced ratio of the p51E(L289K) to p51C(L289K) monomers.
Figures
Similar articles
-
Large Multidomain Protein NMR: HIV-1 Reverse Transcriptase Precursor in Solution.Int J Mol Sci. 2020 Dec 15;21(24):9545. doi: 10.3390/ijms21249545. Int J Mol Sci. 2020. PMID: 33333923 Free PMC article. Review.
-
Relative domain orientation of the L289K HIV-1 reverse transcriptase monomer.Protein Sci. 2022 May;31(5):e4307. doi: 10.1002/pro.4307. Protein Sci. 2022. PMID: 35481647 Free PMC article.
-
The N348I mutation at the connection subdomain of HIV-1 reverse transcriptase decreases binding to nevirapine.J Biol Chem. 2010 Dec 3;285(49):38700-9. doi: 10.1074/jbc.M110.153783. Epub 2010 Sep 27. J Biol Chem. 2010. PMID: 20876531 Free PMC article.
-
Spatial domain organization in the HIV-1 reverse transcriptase p66 homodimer precursor probed by double electron-electron resonance EPR.Proc Natl Acad Sci U S A. 2019 Sep 3;116(36):17809-17816. doi: 10.1073/pnas.1911086116. Epub 2019 Aug 5. Proc Natl Acad Sci U S A. 2019. PMID: 31383767 Free PMC article.
-
TSAO derivatives, inhibitors of HIV-1 reverse transcriptase dimerization: recent progress.Curr Pharm Des. 2006;12(15):1895-907. doi: 10.2174/138161206776873563. Curr Pharm Des. 2006. PMID: 16724955 Review.
Cited by
-
Conformational dependence of 13C shielding and coupling constants for methionine methyl groups.J Biomol NMR. 2010 Sep;48(1):31-47. doi: 10.1007/s10858-010-9436-6. Epub 2010 Aug 24. J Biomol NMR. 2010. PMID: 20734113 Free PMC article.
-
Identification of drivers for the metamorphic transition of HIV-1 reverse transcriptase.Biochem J. 2017 Sep 24;474(19):3321-3338. doi: 10.1042/BCJ20170480. Biochem J. 2017. PMID: 28811321 Free PMC article.
-
Large Multidomain Protein NMR: HIV-1 Reverse Transcriptase Precursor in Solution.Int J Mol Sci. 2020 Dec 15;21(24):9545. doi: 10.3390/ijms21249545. Int J Mol Sci. 2020. PMID: 33333923 Free PMC article. Review.
-
Efavirenz binding site in HIV-1 reverse transcriptase monomers.Biochemistry. 2010 Dec 14;49(49):10565-73. doi: 10.1021/bi101480z. Epub 2010 Nov 19. Biochemistry. 2010. PMID: 21090588 Free PMC article.
-
Structural Maturation of HIV-1 Reverse Transcriptase-A Metamorphic Solution to Genomic Instability.Viruses. 2016 Sep 27;8(10):260. doi: 10.3390/v8100260. Viruses. 2016. PMID: 27690082 Free PMC article. Review.
References
-
- Autran B, Carcelain G, Li TS, Blanc C, Mathez D, Tubiana R, Katlama C, Debre P, Leibowitch J. Positive effects of combined antiretroviral therapy on CD4(+) T cell homeostasis and function in advanced HIV disease. Science. 1997;277:112–116. - PubMed
-
- Staszewski S, Morales-Ramirez J, Tashima KT, Rachlis A, Skiest D, Stanford J, Stryker R, Johnson P, Labriola DF, Farina D, Manion DJ, Ruiz NM. Efavirenz plus zidovudine and lamivudine, efavirenz plus indinavir, and indinavir plus zidovudine and lamivudine in the treatment of HIV-1 infection in adults. Study 006 Team. N Engl J Med. 1999;341:1865–1873. - PubMed
-
- Sluis-Cremer N, Arion D, Abram ME, Parniak MA. Proteolytic processing of an HIV-1 pol polyprotein precursor: insights into the mechanism of reverse transcriptase p66/p51 heterodimer formation. Int J Biochem Cell Biol. 2004;36:1836–1847. - PubMed
-
- Venezia CF, Howard KJ, Ignatov ME, Holladay LA, Barkley MD. Effects of efavirenz binding on the subunit equilibria of HIV-1 reverse transcriptase. Biochemistry. 2006;45:2779–2789. - PubMed
Publication types
MeSH terms
Substances
Grants and funding
LinkOut - more resources
Full Text Sources
