

A collection of bioconductor methods to visualize gene-list annotations
- PMID: 20180973
- PMCID: PMC2829581
- DOI: 10.1186/1756-0500-3-10
A collection of bioconductor methods to visualize gene-list annotations
Abstract
Background: Gene-list annotations are critical for researchers to explore the complex relationships between genes and functionalities. Currently, the annotations of a gene list are usually summarized by a table or a barplot. As such, potentially biologically important complexities such as one gene belonging to multiple annotation categories are difficult to extract. We have devised explicit and efficient visualization methods that provide intuitive methods for interrogating the intrinsic connections between biological categories and genes.
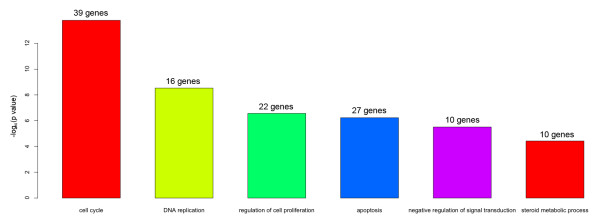
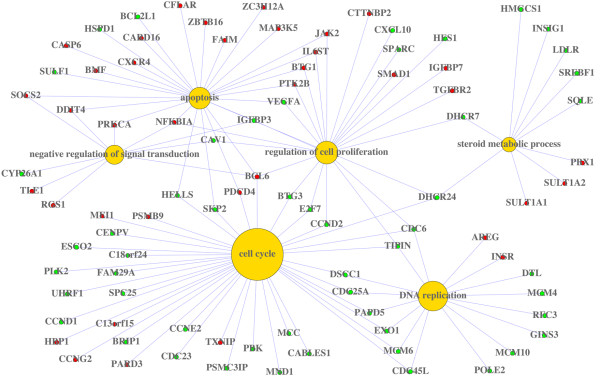
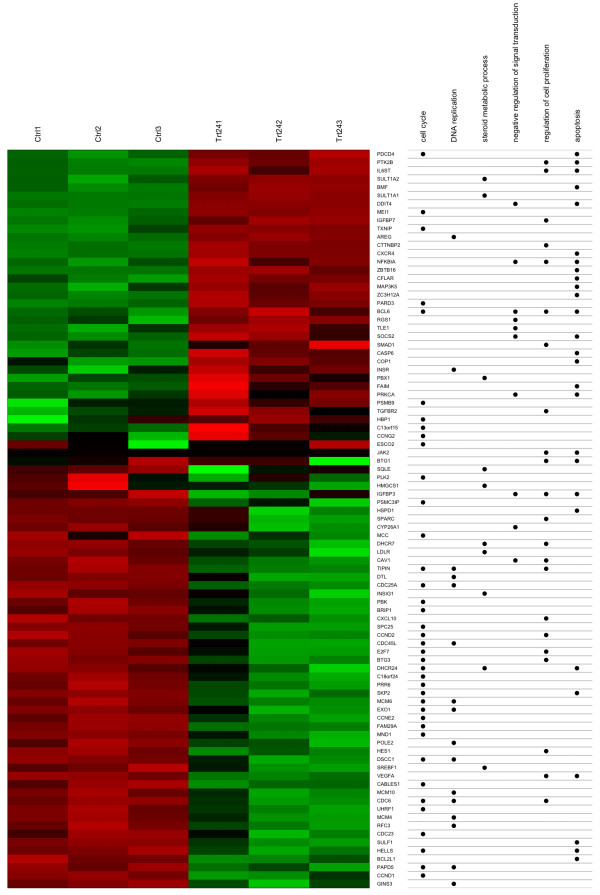
Findings: We have constructed a data model and now present two novel methods in a Bioconductor package, "GeneAnswers", to simultaneously visualize genes, concepts (a.k.a. annotation categories), and concept-gene connections (a.k.a. annotations): the "Concept-and-Gene Network" and the "Concept-and-Gene Cross Tabulation". These methods have been tested and validated with microarray-derived gene lists.
Conclusions: These new visualization methods can effectively present annotations using Gene Ontology, Disease Ontology, or any other user-defined gene annotations that have been pre-associated with an organism's genome by human curation, automated pipelines, or a combination of the two. The gene-annotation data model and associated methods are available in the Bioconductor package called "GeneAnswers " described in this publication.
Figures
References
Grants and funding
LinkOut - more resources
Full Text Sources
Research Materials
