. 2010 Jan 21:3:4.
doi: 10.1186/1756-6606-3-4.

Pyk2 uncouples metabotropic glutamate receptor G protein signaling but facilitates ERK1/2 activation

Affiliations

Pyk2 uncouples metabotropic glutamate receptor G protein signaling but facilitates ERK1/2 activation

Alexander A Nicodemo et al. Mol Brain. .

Abstract

Group I metabotropic glutamate receptors (mGluRs) are coupled via Galphaq/11 to the activation of phospholipase Cbeta, which hydrolyzes membrane phospholipids to form inositol 1,4,5 trisphosphate and diacylglycerol. This results in the release of Ca2+ from intracellular stores and the activation of protein kinase C. The activation of Group I mGluRs also results in ERK1/2 phosphorylation. We show here, that the proline-rich tyrosine kinase 2 (Pyk2) interacts with both mGluR1 and mGluR5 and is precipitated with both receptors from rat brain. Pyk2 also interacts with GST-fusion proteins corresponding to the second intracellular loop and the distal carboxyl-terminal tail domains of mGluR1a. Pyk2 colocalizes with mGluR1a at the plasma membrane in human embryonic kidney (HEK293) cells and with endogenous mGluR5 in cortical neurons. Pyk2 overexpression in HEK293 results in attenuated basal and agonist-stimulated inositol phosphate formation in mGluR1 expressing cells and involves a mechanism whereby Pyk2 displaces Galphaq/11 from the receptor. The activation of endogenous mGluR1 in primary mouse cortical neuron stimulates ERK1/2 phosphorylation. Treatments that prevent Pyk2 phosphorylation in cortical neurons, and the overexpression of Pyk2 dominant-negative and catalytically inactive Pyk2 mutants in HEK293 cells, prevent ERK1/2 phosphorylation. The Pyk2 mediated activation of ERK1/2 phosphorylation is also Src-, calmodulin- and protein kinase C-dependent. Our data reveal that Pyk2 couples the activation mGluRs to the mitogen-activated protein kinase pathway even though it attenuates mGluR1-dependent G protein signaling.


Figures

Figure 1
Figure 1
Pyk2 interacts with Group I mGluRs. A) Representative immunoblot showing the co-immunoprecipitation of HA-Pyk2 with Flag-mGluR1a from HEK293 treated with 30 μM quisqualate for 0, 10, and 20 min. FLAG-mGluR1a is immunopreciptated from 500-1000 μg of protein lysate. The expression of HA-Pyk2 is shown in input lanes correspond to 100 μg of protein lysate. B) The densitometric analysis of autoradiographs showing the mean ± SD of 5 independent experiments examining the co-immunoprecipitation of HA-Pyk2 with FLAG-mGluR5. * P < 0.05 versus untreated cells. C) Representative immunoblotblot showing the co-immunoprecipitation of Pyk2 with mGluR1 and mGluR5 polyclonal antibodies from either 1000 or 500 μg of rat whole brain lysates. The blot is representative of 3 independent experiments. D) Representative immunoblot of HA-Pyk2 co-precipitated with 1 μg of GST, and GST fusion proteins encoding either the second intracellular loop domain of mGluR1 (GST-IL2) or the distal region of the carboxyl-terminal tail domain of mGluR1a (GST-CTC). The GST fusions are incubated with 400 μg of COS-7 cell lysates expressing HA-Pyk2. The expression of HA-Pyk2 is shown in input lanes correspond to 100 μg of protein lysate. E) Representative immunoblot showing the co-immunoprecipitation of HA-Pyk2 with either Flag-mGluR1a-866Δ or FLAG-mGluR1b and HA-Pyk2 and treated with 30 μM quisqualate for 0 and 30 min. FLAG-mGluR1 protein is immunopreciptated from 500-1000 μg of protein lysate. The expression of HA-Pyk2 is shown in input lanes correspond to 100 μg of protein lysate. Data are representative of 4 independent experiments.
Figure 2
Figure 2
Pyk2 colocalizes with Group I mGluRs in HEK 293 cells and in primary mouse cortical neurons. Shown are representative confocal micrographic images of HEK293 cells showing the distribution of HA-Pyk2 and FLAG-mGluR1a distribution in either A) the absence of agonist treatment or B) following treatment with 100 μM quisqualate for 30 min. Cells are transfected with 1 μg of pcDNA3.1 plasmid cDNA encoding HA-Pyk2 and 5 μg of pcDNA3.1 plasmid cDNA encoding FLAG-mGluR1 and are stained with Alexa Fluor-conjugated 568 rabbit polyclonal anti-Flag antibody and Alexa Fluor 488-conjugated mouse monoclonal anti-HA antibody at 4°C. The data is representative 3 independent experiments. Shown are representative confocal micrographic images of primary rat cortical neurons fixed in 4% paraformaldehyde and stained with either Alexa Flour 568-conjugated rabbit polyclonal anti-mGluR1a (C) or mGluR5 (D) antibody and Alexa Fluor 488-conjugated polyclonal rabbit anti-Pyk2 antibody. The micrograph is representative of 3 independent experiments. Scale bars, 10 μm.
Figure 3
Figure 3
Pyk2 expression has no effect on agonist-independent receptor internalization. HEK293 cells transfected with 5 μg of pcDNA3.1 cDNA encoding FLAG-mGluR1a with and without either 5 μg of empty pcDNA3.1 plasmid cDNA or 5 μg of pcDNA3.1 plasmid cDNA encoding HA-Pyk2 were treated with and without 100 μM quisqualate for different time points. The data represent the mean ± S.E.M. of 9 independent experiments.
Figure 4
Figure 4
Effect of Pyk2 expression on mGluR1a signaling. HEK293 cells transfected with 5 μg of pcDNA3.1 cDNA encoding FLAG-mGluR1a with and without either 5 μg of empty pcDNA3.1 plasmid cDNA or 5 μg of pcDNA3.1 plasmid cDNA encoding HA-Pyk2 were assessed for IP formation in either A) the absence of agonist stimulation or B) in response to increasing concentrations of quisqualate (10-8.5-10-4.5M). The agonist dose-response curves were fit and analyzed using GraphPad Prism software. The data points represent the mean ± SEM for 10 independent experiments. *P < 0.05 versus control cells. C) Representative immunoblot showing the effect of HA-Pyk2 expression and GDP-ALF4- treatment on Gαq/11 co-immunoprecipitation with FLAG-mGluR1a. The data points represent the mean ± SD for 4 independent experiments. * P < 0.05 versus untreated cells.
Figure 5
Figure 5
ERK1/2 phosphorylation in mouse cortical neurons is mGluR1-dependent. A) Representative immunoblot of the time course for ERK1/2 phosphorylation in primary mouse cortical neurons treated with 50 μM DHPG. Bar graph shows the denstiometric analysis of the time course of DHPG-stimulated ERK1/2 phosphorylation in cortical neurons. The data represents the mean ± SD of four independent experiments. * P < 0.05 versus untreated cells. B) Representative immunoblot showing the effect of treating primary mouse cortical neurons with and without 50 μM DHPG for 5 min following pretreatment either with or without the mGluR1-selective antagonist LY367385 (100 μM) on ERK1/2 phosphorylation. Bar graph shows the mean ± SD of five independent experiments. C) Representative immunoblot showing the effect of treating primary mouse cortical neurons with and without 50 μM DHPG for 5 min following pretreatment either with or without the mGluR5-selective antagonist MPEP (10 μM) on ERK1/2 phosphorylation. Bar graph shows the mean ± SD of four independent experiments. * P < 0.05 versus untreated mGluR1a expressing cells.
Figure 6
Figure 6
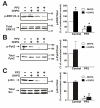
Effect of the Src inhibitor PP2 on ERK1/2, Pyk2 and Src phosphorylation in cortical neurons. A) Representative immunoblot showing the effect of treating primary mouse cortical neurons with and without 50 μM DHPG for 5 min and pretreated either with or without the Src inhibitor PP2 (10 μM) on ERK1/2 phosphorylation. B) Representative immunoblot showing the effect of treating primary mouse cortical neurons with and without 50 μM DHPG for 5 min and pretreated either with or without the Src inhibitor PP2 (10 μM) on Pyk2 (Y402) phosphorylation. B) Representative immunoblot showing the effect of treating primary mouse cortical neurons with and without 50 μM DHPG for 5 min and pretreated either with or without the Src inhibitor PP2 (10 μM) on Src (Y416) phosphorylation. Bar graph shows the mean ± SD of four independent experiments. * P < 0.05 versus untreated mGluR1a expressing cells.
Figure 7
Figure 7
Effect of tyrphostin A9 and calmidazolium chloride on ERK1/2 and Pyk2 phosphorylation in cortical neurons. A) Representative immunoblot showing the effect of treating primary mouse cortical neurons with and without 50 μM DHPG for 5 min and pretreated either with or without tyrphostin A9 (10 μM) on ERK1/2 phosphorylation. Bar graph shows the mean ± SD of nine independent experiments. B) Representative immunoblot showing the effect of treating primary mouse cortical neurons with and without 50 μM DHPG for 5 min and pretreated either with or without tyrphostin A9 (10 μM) on Pyk2 (Y402) phosphorylation. Bar graph shows the mean ± SD of nine independent experiments. C) Representative immunoblot showing the effect of treating primary mouse cortical neurons with and without 50 μM DHPG for 5 min and pretreated either with or without 30 μM calmidazolum chloride (CMZ) on ERK1/2 phosphorylation. Bar graph shows the mean ± SD of five independent experiments. D) Representative immunoblot showing the effect of treating primary mouse cortical neurons with and without 50 μM DHPG for 5 min and pretreated either with or without 30 μM calmidazolum chloride (CMZ) on Pyk2 (Y402) phosphorylation. Bar graph shows the mean ± SD of five independent experiments. * P < 0.05 versus untreated mGluR1a expressing cells.
Figure 8
Figure 8
Effect of Staurosporine on ERK1/2 and Pyk2 phosphorylation in cortical neurons. A) Representative immunoblot showing the effect of treating primary mouse cortical neurons with and without 50 μM DHPG for 5 min and pretreated either with or without staurosporine (1 μM) on ERK1/2 phosphorylation. B) Representative immunoblot showing the effect of treating primary mouse cortical neurons with and without 50 μM DHPG for 5 min and pretreated either with or without staurosporine (1 μM) on Pyk2 (Y402) phosphorylation. Bar graph shows the mean ± SEM of five independent experiments. * P < 0.05 versus untreated mGluR1a expressing cells.
Figure 9
Figure 9
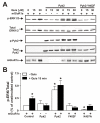
Effect of Pyk2 siRNA treatment on ERK1/2 phosphorylation in cortical neurons and COS7 cells. A) Representative immunoblots showing Pyk2 protein expression, ERK1/2 phosphorylation, and Pyk2 (Y402) phosphorylation in primary mouse cortical neurons treated with 100 nM Pyk2 siRNA and stimulated with and without 50 μM DHPG stimulation for 1 min. B) Bar graph shows the densitometric analysis of ERK1/2 phosphorylation in control, Pyk2 siRNA, and scrambled (Scr) siRNA treated cortical neurons and represents the mean ± SD of five independent experiments. C) Bar graph shows the densitometric analysis of Pyk2 (Y402) phosphorylation in control, Pyk2 siRNA, and scrambled (Scr) siRNA treated cortical neurons and represents the mean ± SD of five independent experiments. D) Representative immunoblots showing the effect of DHPG treatment (50 μM DHGP, 1 min) on Pyk2 protein expression, ERK1/2 phosphorylation, and Pyk2 (Y402) phosphorylation in COS7 cells expressing either FLAG-mGluR1 alone, treated with Pyk2 siRNA alone or expressing FLAG-mGluR1a and treated with Pyk2 siRNA. E) Bar graph shows the densitometric analysis of ERK1/2 phosphorylation in cells transfected with FLAG-mGluR1a alone, cells treated with Pyk2 siRNA alone, and cells transfected with FLAG-mGluR1a and treated with Pyk2 siRNA. F) Bar graph shows the densitometric analysis of Pyk2 (Y402) phosphorylation in cells transfected with FLAG-mGluR1a alone, cells treated with Pyk2 siRNA alone, and cells transfected with FLAG-mGluR1a and treated with Pyk2 siRNA. The graph represents the mean ± SD of four independent experiments. * P < 0.05 versus untreated mGluR1a expressing cells.
Figure 10
Figure 10
Effect of Pyk2-Y402F and Pyk2 overexpression on mGluR1a-mediated ERK1/2 Phosphorylation. A) Representative immunoblots showing, ERK1/2 phosphorylation, ERK/12 protein expression, Pyk2 (Y402) phosphorylation, Pyk2 protein expression and FLAG-mGluR1a expression in cells transfected with and without pCDNA3.1 plasmd cDNAs encoding Flag-mGluR1a (5 μg) with and with 1 μg of pcDNA3.1 plasmid cDNA expressing either wild-type HA-Pyk2 or HA-Pyk2-Y402F. Cells were treated in the absence or presence of 50 μM quisqualate at 37°C. B) Bar graph shows the densitometric analysis of ERK1/2 phosphorylation in cells either expressing FLAG-mGluR1a alone, HA-Pyk2 alone or expressing FLAG-mGluR1a in the presence of HA-Pyk2, HA-Pyk2-Y402F and HA-Pyk2-K457A and is expressed as the mean ± SD of 4-8 different experiments. *P <0.05 compared to basal ERK1/2 phosphorylation levels in mGluR1a expressing cells.

Similar articles

Cited by

References

    1. Nakanishi S. Metabotropic glutamate receptors: synaptic transmission, modulation, and plasticity. Neuron. 1994;13:1031–1037. doi: 10.1016/0896-6273(94)90043-4. - DOI - PubMed
    1. Nakanishi S, Masu M. Molecular diversity and functions of glutamate receptors. Annu Rev Biophys Biomol Struct. 1994;23:319–348. doi: 10.1146/annurev.bb.23.060194.001535. - DOI - PubMed
    1. Conn PJ, Pin JP. Pharmacology and functions of metabotropic glutamate receptors. Annu Rev Pharmacol Toxicol. 1997;37:205–237. doi: 10.1146/annurev.pharmtox.37.1.205. - DOI - PubMed
    1. Pin J-P, Duvoisin R. The metabotropic glutamate receptors: structure and functions. Neuropharmacology. 1995;34:1–26. doi: 10.1016/0028-3908(94)00129-G. - DOI - PubMed
    1. Dhami GK, Ferguson SSG. Metabotropic glutamate receptor desensitization. Pharmacol Ther. 2006;111:260–271. doi: 10.1016/j.pharmthera.2005.01.008. - DOI - PubMed

Publication types

MeSH terms

Substances