. 2010 Jan 29;5(1):5.
doi: 10.1186/1747-1028-5-5.

Self-organization of intracellular gradients during mitosis

Affiliations

Self-organization of intracellular gradients during mitosis

Brian G Fuller. Cell Div. .

Abstract

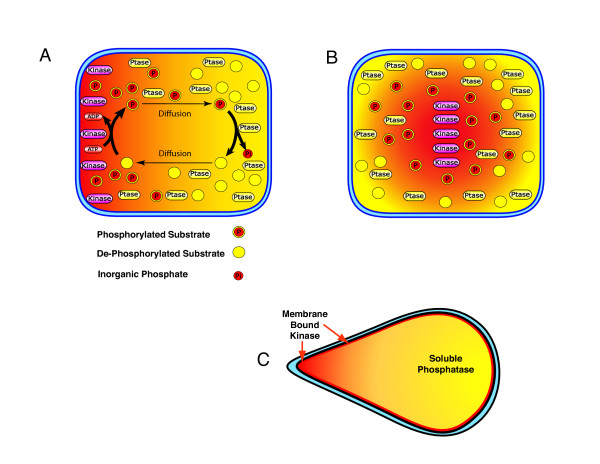
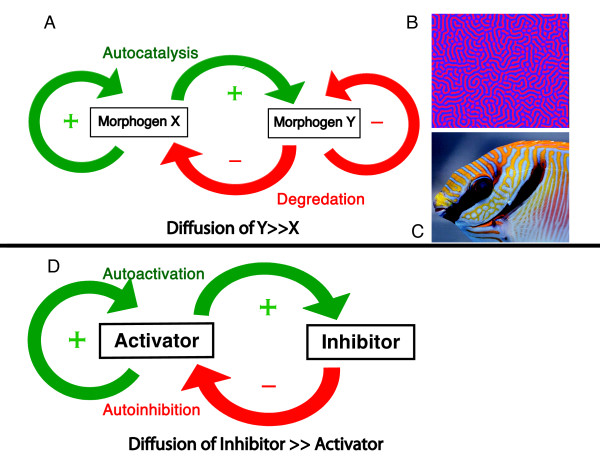
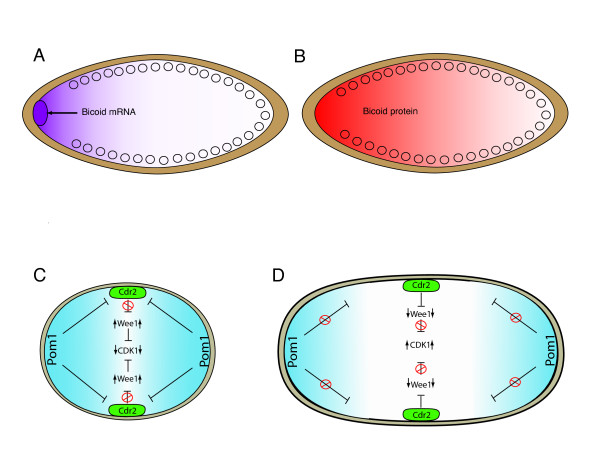
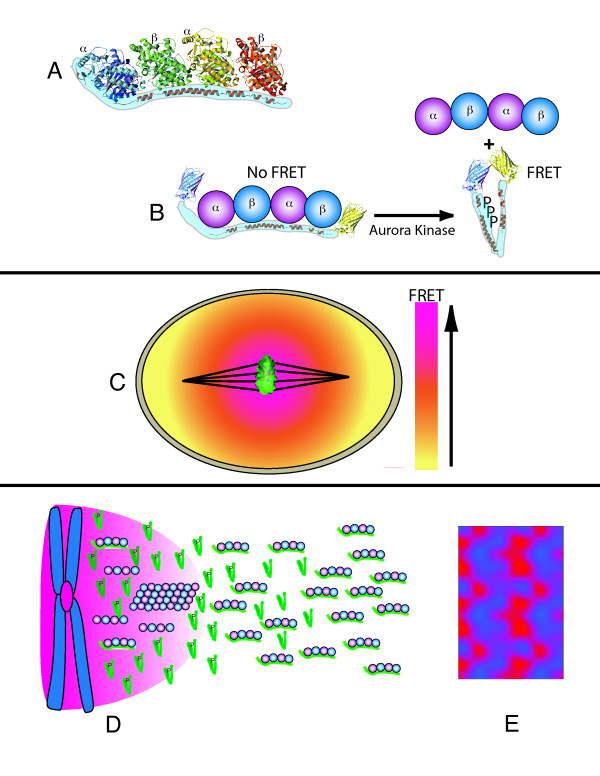
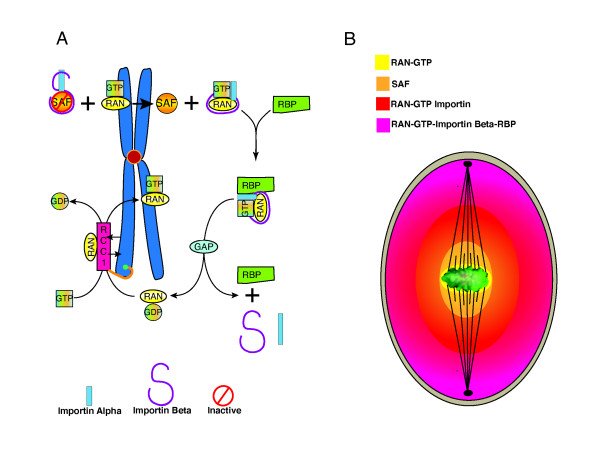
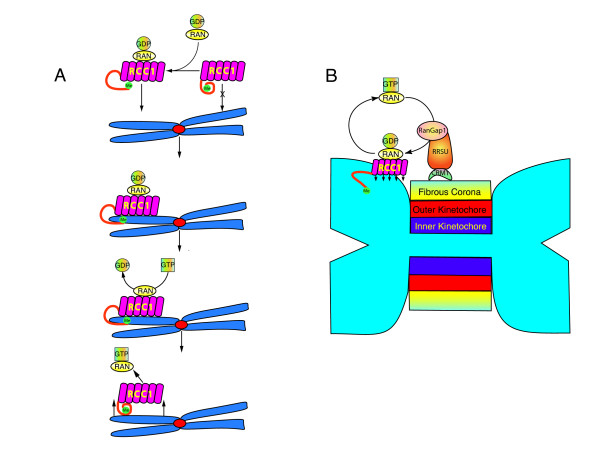
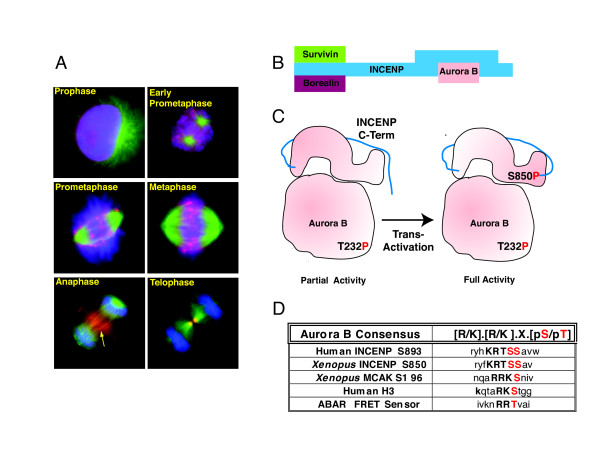
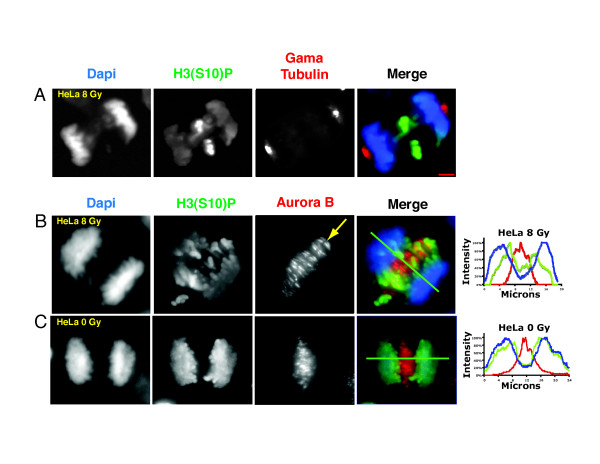
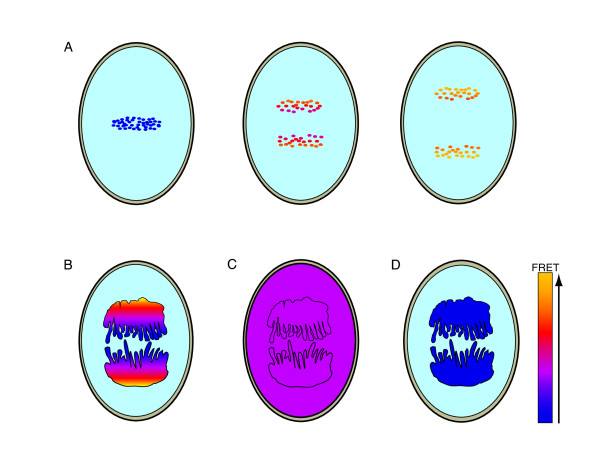
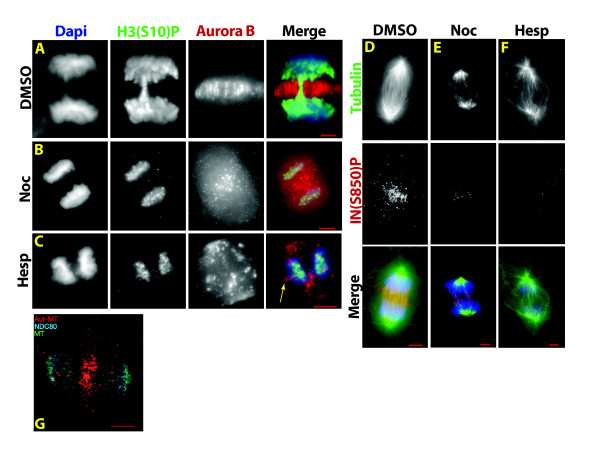
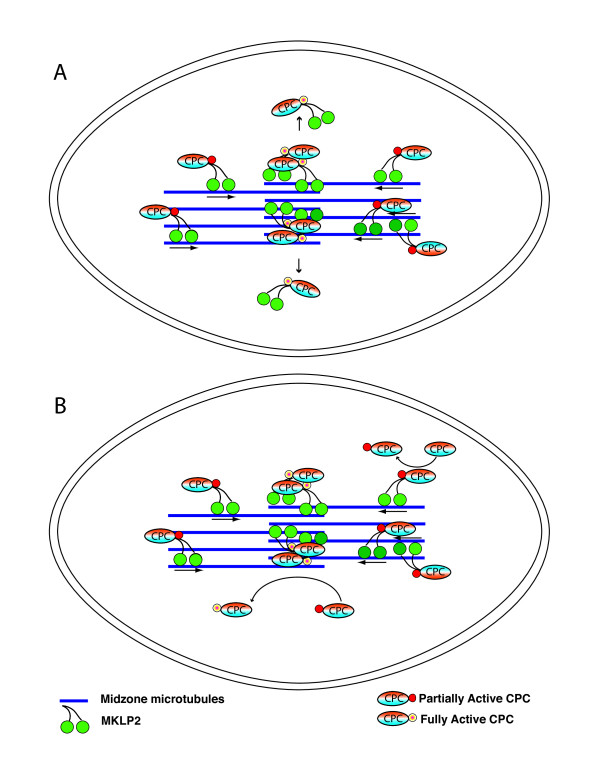
Gradients are used in a number of biological systems to transmit spatial information over a range of distances. The best studied are morphogen gradients where information is transmitted over many cell lengths. Smaller mitotic gradients reflect the need to organize several distinct events along the length of the mitotic spindle. The intracellular gradients that characterize mitosis are emerging as important regulatory paradigms. Intracellular gradients utilize intrinsic auto-regulatory feedback loops and diffusion to establish stable regions of activity within the mitotic cytosol. We review three recently described intracellular mitotic gradients. The Ran GTP gradient with its elaborate cascade of nuclear transport receptors and cargoes is the best characterized, yet the dynamics underlying the robust gradient of Ran-GTP have received little attention. Gradients of phosphorylation have been observed on Aurora B kinase substrates both before and after anaphase onset. In both instances the phosphorylation gradient appears to result from a soluble gradient of Aurora B kinase activity. Regulatory properties that support gradient formation are highlighted. Intracellular activity gradients that regulate localized mitotic events bare several hallmarks of self-organizing biologic systems that designate spatial information during pattern formation. Intracellular pattern formation represents a new paradigm in mitotic regulation.


Figures

Figure 1
Figure 1
Theoretical intracellular phosphorylation gradients. (A and B), a model proposed by Brown and Kholodenko [21,22] predicted that spatial separation of opposing activities (kinase and phosphatase (Ptase)) could produce a gradient (red to yellow) of activated substrates within the cell. The gradients could originate from the plasma membrane (A), or an intracellular structure such as chromatin (B), with the opposing activity homogenously distributed in the cytoplasm. The slope of the gradient is determined by α = √ kp/D where kp is phosphatase activity and D is the diffusion coefficient for proteins in the cytoplasm. (C), a model demonstrating how changes in cell shape can regulate intracellular gradients as proposed by Meyers and Odde [22]. Flattening of the cell at a protrusion or a trailing edge can cause localized increase in phosphorylation of a diffusible substrate, while an increase in cell thickness will cause dephosphorylation.
Figure 2
Figure 2
Models of pattern formation during development. Alan Turing's model of pattern formation arising from the interaction of two morphogens is shown in (A). Red arrows indicate degradation, green arrow indicate autocatalysis. A key aspect of this model is that morphogens X and Y have different diffusion characteristics. (B), An example of a Turing pattern that was generated by a computer simulation of the model summarized in (A). Turing patterns in nature have been identified on squirrels, leopards, zebrafish and in the stripes of the marine angelfish pomacanthus, among others [27,28]. (C), The coloration of this scribbled rabbit fish resembles computer simulated Turing patterns as well as Turing patterns observed on other marine fish. (D), The Gier-Meinhardt model of pattern formation. Autoactivation is coupled to production of an inhibitor of longer range. As a result, a homogenous distribution of activator is unstable resulting in a gradient of activator.
Figure 3
Figure 3
Intracellular gradients during Interphase. (A), The drosophila syncitial embryo utilizes a gradient of bicoid mRNA (purple) that diffuses from the cephalad pole of the embryo, to the caudal pole. This results in a gradient of translated Bicoid protein (red) as shown in (B). (C), A gradient of Pom1 kinase is localized to the cell tips in S. pombe. As the cell grows, the gradient rescinds from the central region of the cell allowing activation of Cdr2 and downstream activation of Cdk-1 to trigger entry into mitosis (D) [38].
Figure 4
Figure 4
The OP18/stathmin phospho-gradient. (A), The structure of alpha/beta tubulin subunits bound OP/18 stathmin. (B), Structure of the FRET sensor COPY. Cyan fluorescent protein (CFP) is bound to the N-terminus, and yellow fluorescent protein (YFP) is bound to the C-terminus of OP/18 stathmin. COPY adopts a rigid structure when bound to tubulin preventing FRET between CFP and YFP. Phosphorylation of COPY releases tubulin allowing interaction of CFP with YFP to produce FRET emissions. (C), A gradient of FRET emissions surrounding mitotic chromatin in HeLa cells is indicative of a gradient of phosphorylated OP/18 stathmin. (D), OP/18 stathmin could act as a local activator and long-range inhibitor of Aurora B kinase activation through effects on microtubule stability. Aurora B is activated by microtubules [43]. Phosphorylation of tubulin-bound OP18/stathmin increases free tubulin, inhibits its ability to induce microtubule catastrophe (promoting microtubule stability/polymerization), and increases OP18/stathmin diffusion by a factor of 2. Phosphorylated stathmin can then diffuse to the periphery where it is de-phosphorylated resulting in tubulin binding/sequestration and promotion of microtubule catastrophe. The gradient of Aurora B activity is shown in pink. (E), Computer generated Turing pattern based on the difference in diffusion coefficients of free and tubulin-bound OP18/stathmin [41].
Figure 5
Figure 5
Ran-GTP gradient. Local production of Ran-GTP by chromatin bound RCC1 produces a series of subordinate Ran-GTP dependent gradients that organize development of the mitotic spindle around chromatin. (A), Localized Ran-GTP production by RCC1 releases spindle assembly factors (SAF) from Importin beta around chromatin where they nucleate microtubules. (B), Diagram of Ran-GTP, SAF, Ran-GTP-Importin beta, and Ran-GTP-Importin beta-RanBP1 diffusion gradients that convey positional information to components of the developing mitotic spindle.
Figure 6
Figure 6
Localization-catalysis coupling of RCC1 self-organizes the Ran-GTP gradient around chromatin. (A), Binding of substrate (Ran-GDP) to RCC1 causes a conformational change in the N-terminal tail of RCC1 to promote binding of RCC1 to chromatin [60]. Exchange of GDP for GTP promotes release of Ran and RCC1 from chromatin. (B), Ran flux at the kinetochore could promote tight association of RCC1 and the RSSU complex to the outer centromere/kinetochore region with reciprocal self-reinforcement. Localized Ran-GTP production promotes RSSU binding to the kinetochore, and local production of Ran-GDP by RSSU promotes tight association of RCC1 to chromatin.
Figure 7
Figure 7
Chromosome passenger complex (CPC). (A), Localization of the CPC during mitosis in Xenopus XTC cells: green, tubulin; blue, Dapi; red, Aurora B. Arrow points to midzone localization of Aurora B (reproduced with permission from Bolton et al, [129] ASCB). (B), Model of the CPC depicting the relationship of survivin and borealin to INCENP's N-terminal region. The C-terminus of INCENP contains the "IN Box" that tightly binds Aurora B. (C), Model of the two-step activation of CPC Aurora B kinase activity. Initial phosphorylation of the T-loop on Aurora B results in partial activation. Phosphorylation of INCENP at Serine 850 results in full activation. Structural and biochemical studies suggest that Aurora B is trans-autoactivated (c-terminus of INCENP shown in blue). (D), Aurora B phosphorylation target motifs.
Figure 8
Figure 8
A gradient of H3 (S10) phosphorylation is evident during anaphase in radiated (A, B), and non-radiated HeLa cells (C). HeLa cells were treated with 8 Gray and fixed for immunofluorescence 16 hours later. Note that DNA damage does not appear to prevent Aurora B kinase activity during the first mitosis following radiation. Lagging chromosomes reveal a positional gradient of H3(S10) phosphorylation that is also evident on untreated HeLa cells. The arrow in the third panel in B indicates loss of Aurora B staining in the central-most region of the spindle midzone. Line graphs in (B) and (C) are intensity profiles through the plane indicated by the green line in figures (B) and (C). Note the peak of H3(S10) phosphorylation intensity is closer to the spindle midzone than the peak of Dapi intensity.
Figure 9
Figure 9
FRET reporters reveal a positional gradient of phosphorylation during anaphase. Phosphorylation of the Aurora B activity reporter ABAR inhibits FRET emissions. (A), centromere targeted ABAR FRET probe; (B,) chromatin targeted ABAR FRET probe; (C), cytosolic, untargeted ABAR FRET probe; (D), Chromosome targeted PLK1 activity FRET probe indicating no evidence of a gradient of PLK1 kinase activity.
Figure 10
Figure 10
Microtubule dependant autoactivation in the spindle midzone generates a gradient of Aurora B activity. (A), control; (B), brief exposure of HeLa cells to Nocodazole causes loss of midzone microtubules, displacement of Aurora B from the midzone, and loss of the histone H3 (S10) phosphorylation gradient. Similarly, inhibition of Aurora B activity by treatment with Hesperadin in (C) results in displacement of Aurora B (arrow), loss of midzone microtubule organization, and loss of the histone H3 (S10) phosphorylation gradient. (D - F), microtubules and Aurora B kinase activity are required for full activation of Aurora B in the spindle midzone. Brief exposure of Xenopus S3 cells to Nocodazole (E), or Hesperadin (F) results in disruption of midzone microtubules and loss of INCENP S850 phosphorylation; (D), control. (G), Aurora B and midzone microtubules physically interact. Proximity-ligation assay (P-Lisa) was used to detect physical interaction between Aurora B and microtubules in anaphase Xenopus S3 cells. Tubulin is stained green, the kinetochore marker Ndc80 is stained blue and P-Lisa product, demonstrating contact between Aurora B and microtubules in the midzone, is shown in red (C, G reproduced with permission from Fuller et al, [3] NPG).
Figure 11
Figure 11
Alternative models of anaphase Aurora B kinase activation and gradient formation. Diagrams A and B depict models of the anaphase midzone. During anaphase, MKLP2 binds the chromosome passenger complex (CPC) to midzone microtubules. MKLP2 plus-end directed motor activity concentrates the CPC in the central most region of the spindle midzone resulting in Aurora B activation such that peak activity is achieved in the center of the spindle midzone. Contact with midzone microtubules, co-activators such as TD60, and/or trans-autoactivation might contribute to Aurora B activation. (A), upon full activation of Aurora B kinase, the CPC is released either through loss of MKLP2-microtubule interactions, or de-polymerization/severing of central midzone microtubules resulting in dissociation of CPC-MKLP2 complexes. This latter model might explain the curious absence of microtubule-bound Aurora B in the central most region of the spindle midzone (Figure 8b). CPC with fully activated Aurora B kinase then diffuses away from the midzone to activate Aurora B in the soluble pool, encounter inactivating phosphatase activity, or be degraded. Alternatively, as in (B), the soluble cytoplasmic pool of CPC diffuses toward the spindle midzone where it is trans-activated by midzone bound CPC with highly active Aurora B. Cellular phosphatase activity (not shown for simplicity) should play a major role in regulation of the Aurora B activity gradient (see text for additional details).

Similar articles

Cited by

References

    1. Niethammer P, Bastiaens P, Karsenti E. Stathmin-tubulin interaction gradients in motile and mitotic cells. Science. 2004;303(5665):1862–6. doi: 10.1126/science.1094108. - DOI - PubMed
    1. Kaláb P, Pralle A, Isacoff EY, Heald R, Weis K. Analysis of a RanGTP-regulated gradient in mitotic somatic cells. Nature. 2006;440(7084):697–701. doi: 10.1038/nature04589. - DOI - PubMed
    1. Fuller BG, Lampson MA, Foley EA, Rosasco-Nitcher S, Le KV, Tobelmann P, Brautigan DL, Stukenberg PT, Kapoor TM. Midzone activation of aurora B in anaphase produces an intracellular phosphorylation gradient. Nature. 2008;453(7198):1132–6. doi: 10.1038/nature06923. - DOI - PMC - PubMed
    1. Kalab P, Weis K, Heald R. Visualization of a Ran-GTP gradient in interphase and mitotic Xenopus egg extracts. Science. 2002;295(5564):2452–6. doi: 10.1126/science.1068798. - DOI - PubMed
    1. Gadde S, Heald R. Mechanisms and molecules of the mitotic spindle. Curr Biol. 2004;14(18):R797–805. doi: 10.1016/j.cub.2004.09.021. - DOI - PubMed

LinkOut - more resources