

Multi-locus models of genetic risk of disease
- PMID: 20181060
- PMCID: PMC2847701
- DOI: 10.1186/gm131
Multi-locus models of genetic risk of disease
Abstract
Background: Evidence for genetic contribution to complex diseases is described by recurrence risks to relatives of diseased individuals. Genome-wide association studies allow a description of the genetics of the same diseases in terms of risk loci, their effects and allele frequencies. To reconcile the two descriptions requires a model of how risks from individual loci combine to determine an individual's overall risk.
Methods: We derive predictions of risk to relatives from risks at individual loci under a number of models and compare them with published data on disease risk.
Results: The model in which risks are multiplicative on the risk scale implies equality between the recurrence risk to monozygotic twins and the square of the recurrence risk to sibs, a relationship often not observed, especially for low prevalence diseases. We show that this theoretical equality is achieved by allowing impossible probabilities of disease. Other models, in which probabilities of disease are constrained to a maximum of one, generate results more consistent with empirical estimates for a range of diseases.
Conclusions: The unconstrained multiplicative model, often used in theoretical studies because of its mathematical tractability, is not a realistic model. We find three models, the constrained multiplicative, Odds (or Logit) and Probit (or liability threshold) models, all fit the data on risk to relatives. Currently, in practice it would be difficult to differentiate between these models, but this may become possible if genetic variants that explain the majority of the genetic variance are identified.
Figures
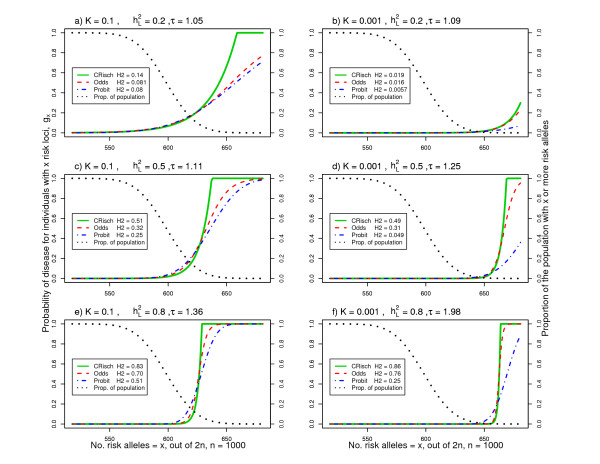
 , and disease prevalence, K, determine the relative risk of a single locus, τ. The legend lists the resulting broad sense heritability on the risk scale,
  (H2 in the legend). The shape of the risk functions is achieved with other combinations of n and p for the same K and .
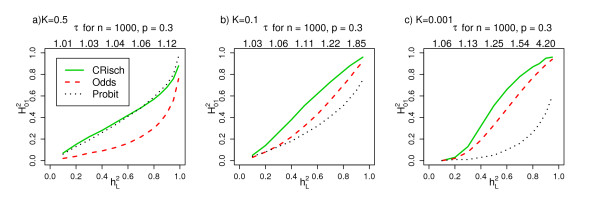 for the CRisch, Odds and Probit models and , heritability on the underlying liability scale. (a-c) For each , τ is estimated from the Probit model simulation and used as an input for the other models, so that all three models are benchmarked by K and τ. The shape of the relationship is not dependent on the choice of n and p; the τ when = 0.1, 0.3, 0.5, 0.7 and 0.9 are listed above each graph when n = 1,000 and p = 0.3. From simulations of a single population of 106 individuals.
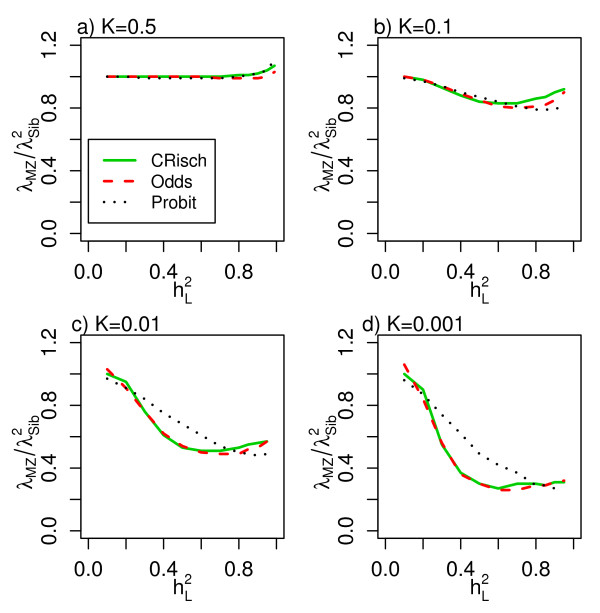
 and for the CRisch, Odds and Probit models. (a-d) Relationship for different disease prevalences (K).
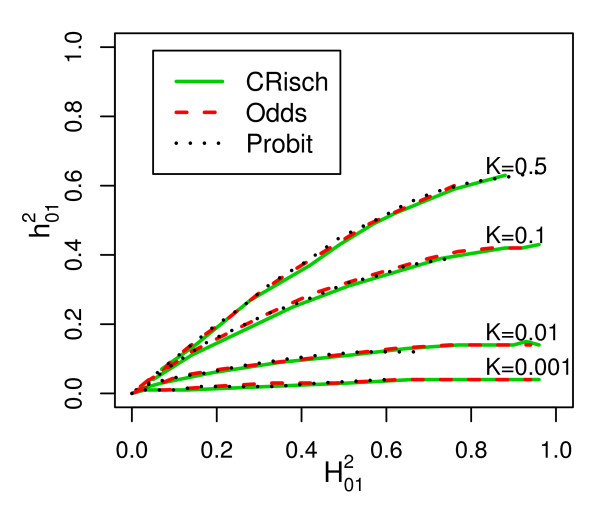
 and broad sense heritability on the risk scale for different disease prevalences (K). From simulations of a single population of 106 individuals, with calculated as 4(λOG - 1)K/(1-K) where λOG is the recurrence risk of disease in grandchildren of affected grandparents and calculated from Equation 2.
References
LinkOut - more resources
Full Text Sources
