. 2010 Feb 24:11:134.
doi: 10.1186/1471-2164-11-134.

Correcting for intra-experiment variation in Illumina BeadChip data is necessary to generate robust gene-expression profiles

Affiliations

Correcting for intra-experiment variation in Illumina BeadChip data is necessary to generate robust gene-expression profiles

Robert R Kitchen et al. BMC Genomics. .

Abstract

Background: Microarray technology is a popular means of producing whole genome transcriptional profiles, however high cost and scarcity of mRNA has led many studies to be conducted based on the analysis of single samples. We exploit the design of the Illumina platform, specifically multiple arrays on each chip, to evaluate intra-experiment technical variation using repeated hybridisations of universal human reference RNA (UHRR) and duplicate hybridisations of primary breast tumour samples from a clinical study.

Results: A clear batch-specific bias was detected in the measured expressions of both the UHRR and clinical samples. This bias was found to persist following standard microarray normalisation techniques. However, when mean-centering or empirical Bayes batch-correction methods (ComBat) were applied to the data, inter-batch variation in the UHRR and clinical samples were greatly reduced. Correlation between replicate UHRR samples improved by two orders of magnitude following batch-correction using ComBat (ranging from 0.9833-0.9991 to 0.9997-0.9999) and increased the consistency of the gene-lists from the duplicate clinical samples, from 11.6% in quantile normalised data to 66.4% in batch-corrected data. The use of UHRR as an inter-batch calibrator provided a small additional benefit when used in conjunction with ComBat, further increasing the agreement between the two gene-lists, up to 74.1%.

Conclusion: In the interests of practicalities and cost, these results suggest that single samples can generate reliable data, but only after careful compensation for technical bias in the experiment. We recommend that investigators appreciate the propensity for such variation in the design stages of a microarray experiment and that the use of suitable correction methods become routine during the statistical analysis of the data.


Figures

Figure 1
Figure 1
Layout of samples on the Illumina BeadChips and flowchart of the analysis approach. A, Illustration of the positions of samples on the 18 BeadChips, processed in five batches (also referred to as 'runs') corresponding to the five different days on which the samples were hybridised and scanned. UHRR samples are labelled as C1-18. Duplicate breast tumour clinical samples are labelled a and b. The pre- and post-treatment biopsy samples are identified by a triangle to the left and right of the sample IDs, respectively. B, Flowchart of analysis methods
Figure 2
Figure 2
Intra and inter-run variation in UHRR samples: Pearson-correlations. Pairwise UHRR Pearson-correlation heatmaps highlight the batch differences, particularly between run 2 and run 4. Red cells correspond to ~97% correlation and white to 100% correlation. Batches and sample numbers are consistent with the colouring and labelling in Figure 1. All data were detection filtered, as described in methods. A = raw data; B = normalised; C = quantile normalised, plus mean-centring; D = quantile normalised, plus ComBat.
Figure 3
Figure 3
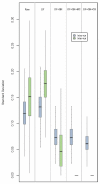
Intra and inter-run variation in UHRR samples: Nested-ANOVA. The results of a nested-ANOVA, quantifying the probe-wise components of variation corresponding to the within (blue) and between (green) batch variance. The model and calculation used are as described in methods. Effects on these standard deviations after detection-filtering (DF), quantile-normalisation (QN), mean-centring (MC), and ComBat (CB) are shown.
Figure 4
Figure 4
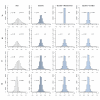
Distribution of the differences between replicate pairs of intra- and inter run intensity measurements. All possible combinations of differences between replicate pairs of UHRR controls and clinical samples were compared across the five runs. Axis labels represent the difference between duplicate samples (δ) on the x-axis, against frequency (ν) on the y-axis. Values on the left of each distribution represent the standard deviation and values on the right represent the mean of the measured differences. The four columns illustrate the effect of normalisation or batch correction on these differences. The four rows of plots illustrate both inter- and intra-run differences for both UHRR and tumour samples; row 'A' contains inter-run differences calculated between the 128 pairs of UHRR samples; row 'B' corresponds to intra-run differences between the 25 pairs of UHRR; row 'C' is the inter-run differences in the 56 pairs of tumour samples; and row 'D' contains data for the intra-run differences in 7 pairs of tumour samples in Run 5.
Figure 5
Figure 5
Intra and Inter-run comparisons of clinical duplicates. Mean Pearson-correlations between replicate pairs of tumour samples (A and B) on different chips and runs. Colours denote the four different data types; raw, quantile normalised (QN), quantile normalised then mean centred (QN+MC), and quantile normalised then ComBat corrected (QN+CB). Expressions were generally highly correlated except in the chips straddling runs 4 and 5. ComBat is able to correct for a significant amount of this difference. Error bars represent the standard error.
Figure 6
Figure 6
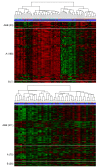
Differentially expressed genes with duplicates treated as separate datasets. Heatmaps of genes found to be differentially expressed in each of the A and B replicate datasets of samples and the overlap after quantile normalisation (top) and ComBat batch-correction (bottom). The batch in which each sample was present is denoted by bar beneath the dendrogram, in which the run-colours are consistent with those in Figure 1, and the sample-type is illustrated by the blue bar (light = post-treatment, dark = pre-treatment). The numbers of probes differentially expressed in both A and B ('A&B') or 'A' only and 'B' only are shown in brackets. Sample clustering (by complete linkage) in each heatmap was determined by only those probes in the 'A&B' group.

References

    1. Sims AH. Bioinformatics and breast cancer: what can high-throughput genomic approaches actually tell us? J Clin Pathol. 2009;62(10):879–885. doi: 10.1136/jcp.2008.060376. - DOI - PubMed
    1. Ramaswamy S, Golub TR. DNA microarrays in clinical oncology. J Clin Oncol. 2002;20(7):1932–1941. - PubMed
    1. Clarke R, Ressom HW, Wang A, Xuan J, Liu MC, Gehan EA, Wang Y. The properties of high-dimensional data spaces: implications for exploring gene and protein expression data. Nat Rev Cancer. 2008;8(1):37–49. doi: 10.1038/nrc2294. - DOI - PMC - PubMed
    1. Brazma A, Hingamp P, Quackenbush J, Sherlock G, Spellman P, Stoeckert C, Aach J, Ansorge W, Ball CA, Causton HC, Gaasterland T, Glenisson P, Holstege FC, Kim IF, Markowitz V, Matese JC, Parkinson H, Robinson A, Sarkans U, Schulze-Kremer S, Stewart J, Taylor R, Vilo J, Vingron M. Minimum information about a microarray experiment (MIAME)-toward standards for microarray data. Nat Genet. 2001;29(4):365–371. doi: 10.1038/ng1201-365. - DOI - PubMed
    1. Baggerly KA, Coombes KR. Deriving Chemosensitivity from Cell Lines: Forensic Bioinformatics and Reproducible Research in High-Throughput Biology. Annals of Applied Statistics. in press .

Publication types

LinkOut - more resources