. 2010 Feb 24:11:104.
doi: 10.1186/1471-2105-11-104.

Probe set filtering increases correlation between Affymetrix GeneChip and qRT-PCR expression measurements

Affiliations

Probe set filtering increases correlation between Affymetrix GeneChip and qRT-PCR expression measurements

Jakub Mieczkowski et al. BMC Bioinformatics. .

Abstract

Background: Affymetrix GeneChip microarrays are popular platforms for expression profiling in two types of studies: detection of differential expression computed by p-values of t-test and estimation of fold change between analyzed groups. There are many different preprocessing algorithms for summarizing Affymetrix data. The main goal of these methods is to remove effects of non-specific hybridization, and to optimally combine information from multiple probes annotated to the same transcript. The methods are benchmarked by comparison with reference methods, such as quantitative reverse-transcription PCR (qRT-PCR).

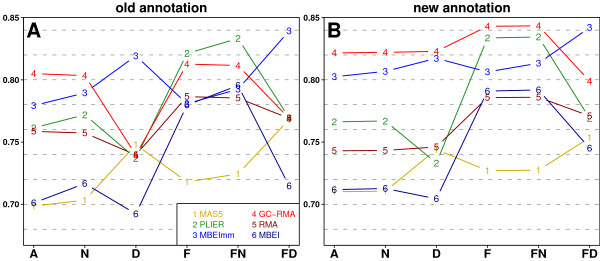
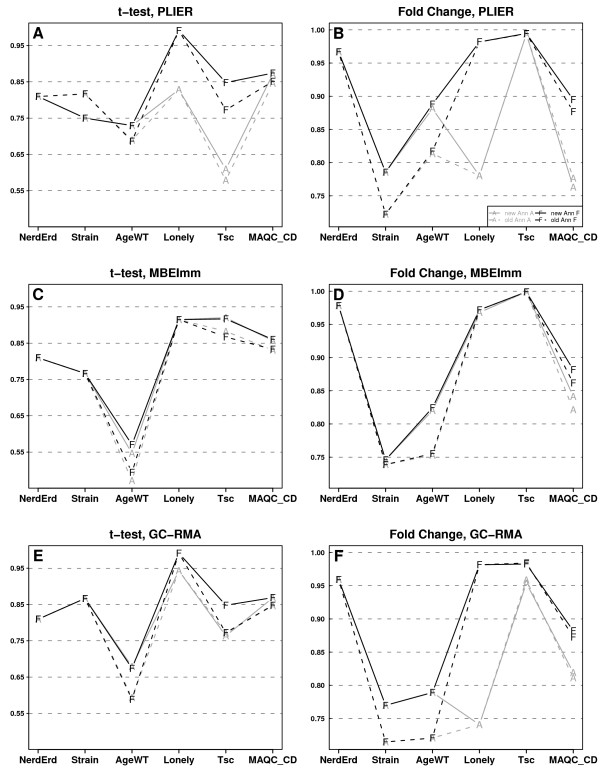
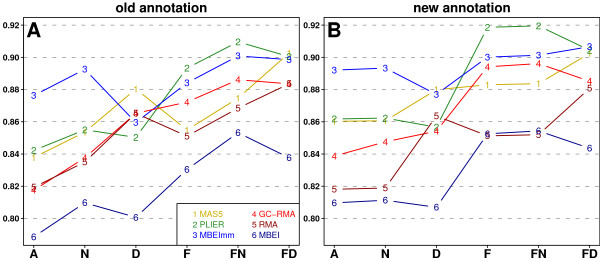
Results: We present a comprehensive analysis of agreement between Affymetrix GeneChip and qRT-PCR results. We analyzed the influence of filtering by fraction Present calls introduced by J.N. McClintick and H.J. Edenberg (2006) and 2 mapping procedures: updated probe sets definitions proposed by Dai et al. (2005) and our "naive mapping" method. Because of evolution of genome sequence annotations since the time when microarrays were designed, we also studied the effect of the annotation release date. These comparisons were prepared for 6 popular preprocessing algorithms (MAS5, PLIER, RMA, GC-RMA, MBEI, and MBEImm) in the 2 above-mentioned types of studies. We used data sets from 6 independent biological experiments. As a measure of reproducibility of microarray and qRT-PCR values, we used linear and rank correlation coefficients.

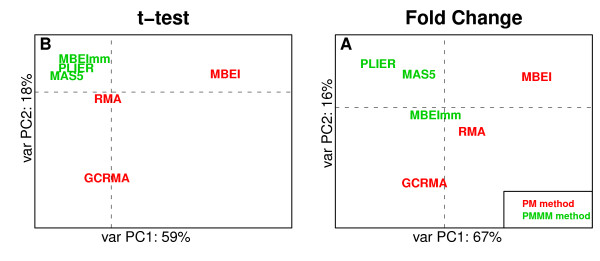
Conclusions: We show that filtering by fraction Present calls increased correlations for all 6 preprocessing algorithms. We observed the difference in performance of PM-MM and PM-only methods: using MM probes increased correlations in fold change studies, but PM-only methods proved to perform better in detection of differential expression. We recommend using GC-RMA for detection of differential expression and PLIER for estimation of fold change. The use of the more recent annotation improves the results in both types of studies, encouraging re-analysis of old data.


Figures

Figure 1
Figure 1
Average Spearman's correlations between MA and qRT-PCR detection of differentially expressed genes. Plots present average correlations between values of Welch's t-statistic calculated from MA and qRT-PCR measurements. Average values were calculated for each of the 6 preprocessing algorithms over the 6 data sets in each of the 6 filtering/mapping methods. Panel A shows results for the old annotation while panel B presents results for the new annotation. Curves are coloured and numbered to indicate the preprocessing algorithms.
Figure 2
Figure 2
Correlations of the most reproducible preprocessing algorithms. Plots of correlations for 2 filtering/mapping methods, A and F, and both annotations in 2 applications (estimation of fold change and detection of differential expression), obtained for 3 preprocessing algorithms (PLIER, MBEImm, and GC-RMA). Colours denote filtering/mapping methods: A - grey, F - black while a line style stands for annotation: solid line - the new annotation, dashed line - the old annotation.
Figure 3
Figure 3
Average Pearson's correlations between MA and qRT-PCR fold change. Plots present average correlations between values of fold change calculated from MA and qRT-PCR measurements. Plot A shows results for the old annotation while plot B presents results for the new annotation. Curves are coloured and numbered to indicate the preprocessing algorithms.
Figure 4
Figure 4
Principal Component Analysis of preprocessing algorithms in variant A. Plots present Principal Component Analysis of preprocessing algorithms on sample types A and B from MAQC study. Algorithms using the MM probes are marked green while the PM-only algorithms are marked red. (A) PCA of values of Welch's t-statistic from microarray and qRT-PCR detection of differentially expressed genes. (B) PCA of values of fold change between groups. In both cases the new annotation was used. Axes are labelled with percentage of total variability explained by PC1 and PC2. It should be noted that in this technical comparison we used samples of original RNA instead of mixtures C and D.

References

    1. Shedden K, Chen W, Kuick R, Ghosh D, MacDonald J, Cho KR, Giordano TJ, Gruber SB, Fearon ER, Taylor JMG, Hanash S. Comparison of seven methods for producing Affymetrix expression scores based on False Discovery Rates in disease profiling data. BMC Bioinformatics. 2005;6:26. doi: 10.1186/1471-2105-6-26. - DOI - PMC - PubMed
    1. Zakharkin SO, Kim K, Mehta T, Chen L, Barnes S, Scheirer KE, Parrish RS, Allison DB, Page GP. Sources of variation in Affymetrix microarray experiments. BMC Bioinformatics. 2005;6:214. doi: 10.1186/1471-2105-6-214. - DOI - PMC - PubMed
    1. Millenaar FF, Okyere J, May ST, van Zanten M, Voesenek LA, Peeters AJ. How to decide? Different methods of calculating gene expression from short oligonucleotide array data will give different results. BMC Bioinformatics. 2006;7:137. doi: 10.1186/1471-2105-7-137. - DOI - PMC - PubMed
    1. Seo J, Hoffman EP. Probe set algorithms: Is there a rational best bet? BMC Bioinformatics. 2006;7:395. doi: 10.1186/1471-2105-7-395. - DOI - PMC - PubMed
    1. Irizarry RA, Wu Z, Jaffee H. Comparison of Affymetrix GeneChip expression measures. Bioinformatics. 2006;22:789–794. doi: 10.1093/bioinformatics/btk046. - DOI - PubMed

Publication types

MeSH terms