

Flux of transcript patterns during soybean seed development
- PMID: 20181280
- PMCID: PMC2846912
- DOI: 10.1186/1471-2164-11-136
Flux of transcript patterns during soybean seed development
Abstract
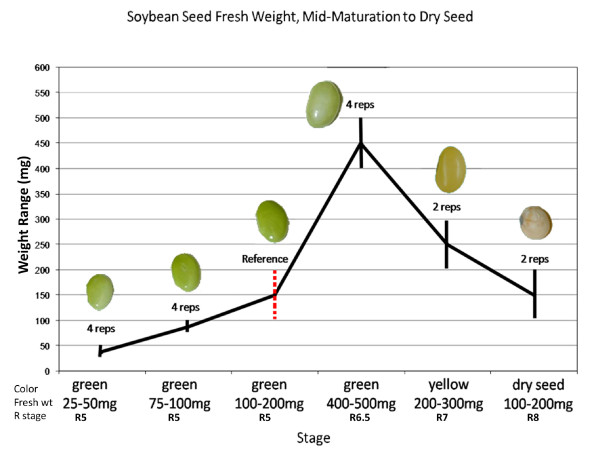
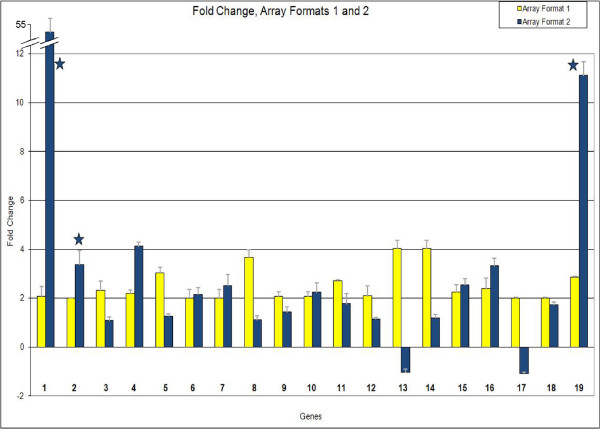
Background: To understand gene expression networks leading to functional properties of the soybean seed, we have undertaken a detailed examination of soybean seed development during the stages of major accumulation of oils, proteins, and starches, as well as the desiccating and mature stages, using microarrays consisting of up to 27,000 soybean cDNAs. A subset of these genes on a highly-repetitive 70-mer oligonucleotide microarray was also used to support the results.
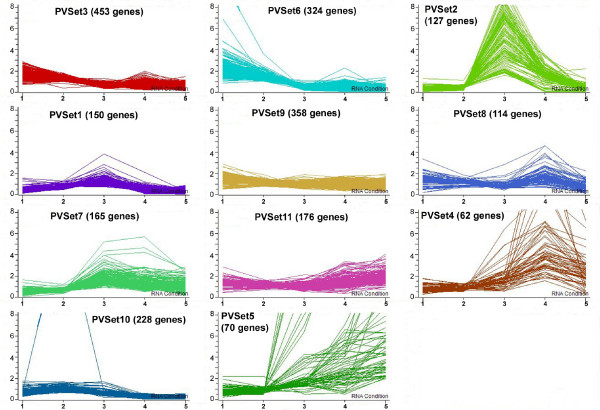
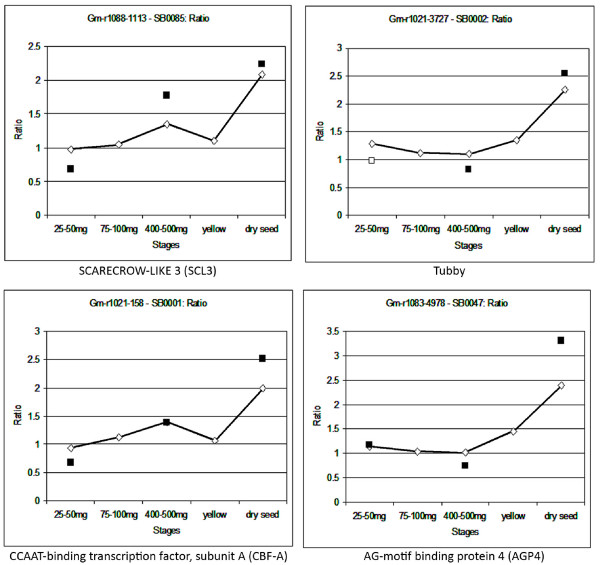
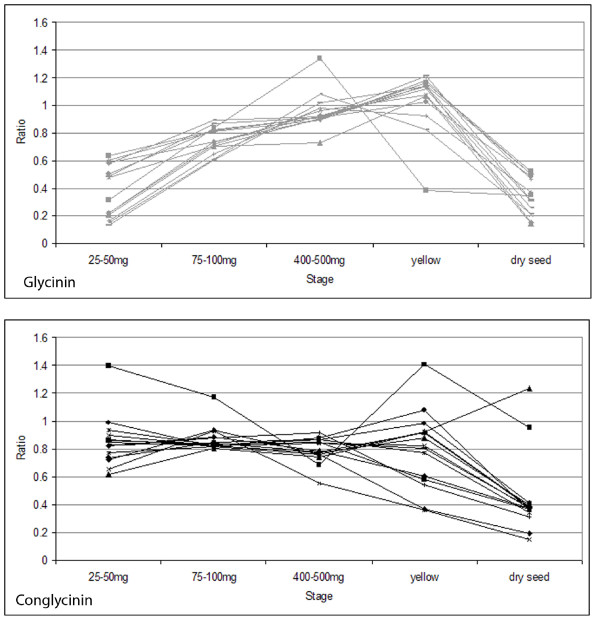
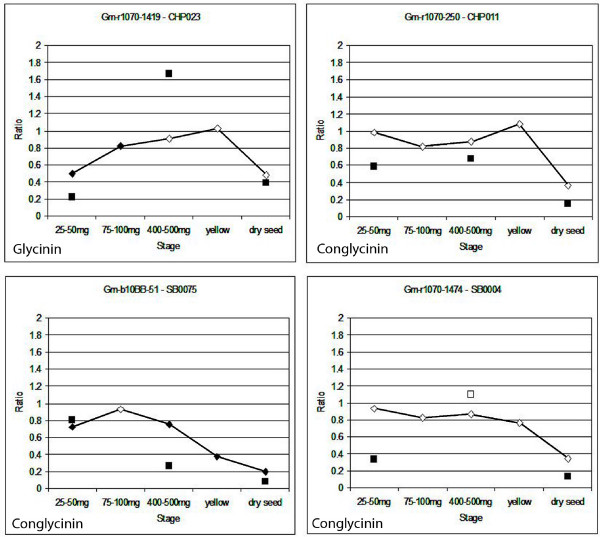
Results: It was discovered that genes related to cell growth and maintenance processes, as well as energy processes like photosynthesis, decreased in expression levels as the cotyledons approached the mature, dry stage. Genes involved with some storage proteins had their highest expression levels at the stage of highest fresh weight. However, genes encoding many transcription factors and DNA binding proteins showed higher expression levels in the desiccating and dry seeds than in most of the green stages.
Conclusions: Data on 27,000 cDNAs have been obtained over five stages of soybean development, including the stages of major accumulation of agronomically-important products, using two different types of microarrays. Of particular interest are the genes found to peak in expression at the desiccating and dry seed stages, such as those annotated as transcription factors, which may indicate the preparation of pathways that will be needed later in the early stages of imbibition and germination.
Figures
Similar articles
-
Using RNA-Seq to profile soybean seed development from fertilization to maturity.PLoS One. 2013;8(3):e59270. doi: 10.1371/journal.pone.0059270. Epub 2013 Mar 15. PLoS One. 2013. PMID: 23555009 Free PMC article.
-
Microarrays for global expression constructed with a low redundancy set of 27,500 sequenced cDNAs representing an array of developmental stages and physiological conditions of the soybean plant.BMC Genomics. 2004 Sep 29;5:73. doi: 10.1186/1471-2164-5-73. BMC Genomics. 2004. PMID: 15453914 Free PMC article.
-
Meta-analysis and transcriptome profiling reveal hub genes for soybean seed storage composition during seed development.Plant Cell Environ. 2018 Sep;41(9):2109-2127. doi: 10.1111/pce.13175. Epub 2018 Apr 15. Plant Cell Environ. 2018. PMID: 29486529
-
Whole genome-wide transcript profiling to identify differentially expressed genes associated with seed field emergence in two soybean low phytate mutants.BMC Plant Biol. 2017 Jan 18;17(1):16. doi: 10.1186/s12870-016-0953-7. BMC Plant Biol. 2017. PMID: 28100173 Free PMC article.
-
A seed germination transcriptomic study contrasting two soybean genotypes that differ in terms of their tolerance to the deleterious impacts of elevated temperatures during seed fill.BMC Res Notes. 2019 Aug 19;12(1):522. doi: 10.1186/s13104-019-4559-7. BMC Res Notes. 2019. PMID: 31426836 Free PMC article.
Cited by
-
A new set of ESTs from chickpea (Cicer arietinum L.) embryo reveals two novel F-box genes, CarF-box_PP2 and CarF-box_LysM, with potential roles in seed development.PLoS One. 2015 Mar 24;10(3):e0121100. doi: 10.1371/journal.pone.0121100. eCollection 2015. PLoS One. 2015. PMID: 25803812 Free PMC article.
-
A Comparison of transgenic and wild type soybean seeds: analysis of transcriptome profiles using RNA-Seq.BMC Biotechnol. 2015 Oct 1;15:89. doi: 10.1186/s12896-015-0207-z. BMC Biotechnol. 2015. PMID: 26427366 Free PMC article.
-
Global transcriptome analysis and identification of genes involved in nutrients accumulation during seed development of rice tartary buckwheat (Fagopyrum Tararicum).Sci Rep. 2017 Sep 18;7(1):11792. doi: 10.1038/s41598-017-11929-z. Sci Rep. 2017. PMID: 28924217 Free PMC article.
-
Insight Into the Prospects for the Improvement of Seed Starch in Legume-A Review.Front Plant Sci. 2019 Oct 31;10:1213. doi: 10.3389/fpls.2019.01213. eCollection 2019. Front Plant Sci. 2019. PMID: 31736985 Free PMC article. Review.
-
Metabolic flux analysis to increase oil in seeds.Plant Physiol. 2025 Feb 7;197(2):kiae595. doi: 10.1093/plphys/kiae595. Plant Physiol. 2025. PMID: 39499667 Free PMC article. Review.
References
-
- Ritchie SW, Hanway JJ, Thompson HE, Benson GO. How a soybean plant develops. Special Report No. 53. Ames IA: Iowa State University of Science and Technology Cooperative Extension Service; 1996.
-
- Bewley JD, Hempel FD, McCormick S, Zambryski P. In: Biochemistry and Molecular Biology of Plants. Buchanan BB, Gruissem W, Jones RL, editor. Rockville MD: American Society of Plant Physiologists; 2000. Reproductive development; pp. 988–1043.
-
- Rosenberg LA, Rinne RW. Moisture loss as a prerequisite for seedling growth in soybean seeds. J Exp Bot. 1986;37:1663–1674. doi: 10.1093/jxb/37.11.1663. - DOI
-
- Carlson JB, Lersten NR. In: Soybeans: Improvement, Production, and Uses. Boerma HR, Specht JE, editor. Madison WI: American Society of Agronomy; 2004. Reproductive morphology; pp. 59–95.
Publication types
MeSH terms
Substances
LinkOut - more resources
Full Text Sources
Molecular Biology Databases
Miscellaneous
