. 2010 Feb 25:11:137.
doi: 10.1186/1471-2164-11-137.

Genome-wide analysis of aberrant methylation in human breast cancer cells using methyl-DNA immunoprecipitation combined with high-throughput sequencing

Affiliations

Genome-wide analysis of aberrant methylation in human breast cancer cells using methyl-DNA immunoprecipitation combined with high-throughput sequencing

Yoshinao Ruike et al. BMC Genomics. .

Abstract

Background: Cancer cells undergo massive alterations to their DNA methylation patterns that result in aberrant gene expression and malignant phenotypes. However, the mechanisms that underlie methylome changes are not well understood nor is the genomic distribution of DNA methylation changes well characterized.

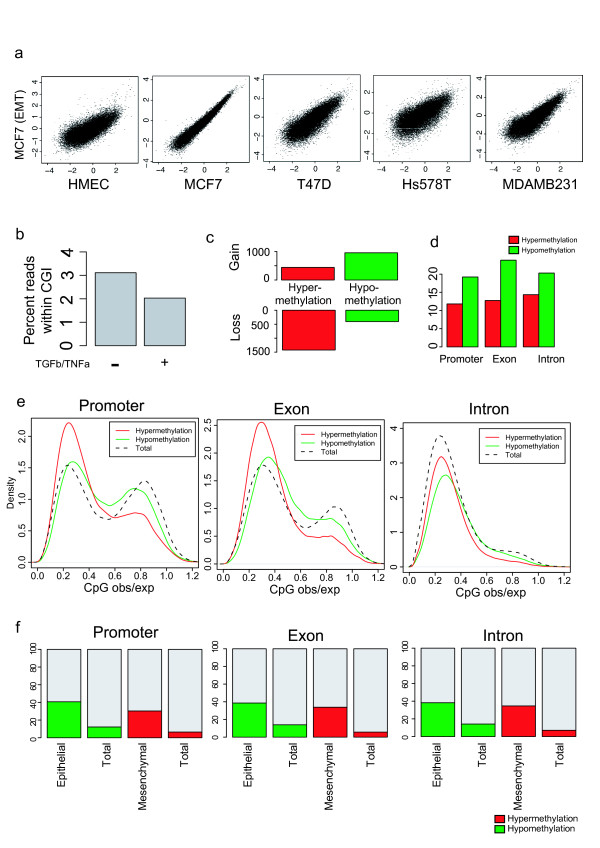
Results: Here, we performed methylated DNA immunoprecipitation combined with high-throughput sequencing (MeDIP-seq) to obtain whole-genome DNA methylation profiles for eight human breast cancer cell (BCC) lines and for normal human mammary epithelial cells (HMEC). The MeDIP-seq analysis generated non-biased DNA methylation maps by covering almost the entire genome with sufficient depth and resolution. The most prominent feature of the BCC lines compared to HMEC was a massively reduced methylation level particularly in CpG-poor regions. While hypomethylation did not appear to be associated with particular genomic features, hypermethylation preferentially occurred at CpG-rich gene-related regions independently of the distance from transcription start sites. We also investigated methylome alterations during epithelial-to-mesenchymal transition (EMT) in MCF7 cells. EMT induction was associated with specific alterations to the methylation patterns of gene-related CpG-rich regions, although overall methylation levels were not significantly altered. Moreover, approximately 40% of the epithelial cell-specific methylation patterns in gene-related regions were altered to those typical of mesenchymal cells, suggesting a cell-type specific regulation of DNA methylation.

Conclusions: This study provides the most comprehensive analysis to date of the methylome of human mammary cell lines and has produced novel insights into the mechanisms of methylome alteration during tumorigenesis and the interdependence between DNA methylome alterations and morphological changes.


Figures

Figure 1
Figure 1
BCCs undergo massive overall loss of methylation. (a) The number of differentially methylated 100 kb segments were counted for each cell lines. (b) Log scaled scatter plot of the MeDIP/Input ratio in each 100 kb segments for HMEC and BCCs (for BCCs the average ratio is shown). The red and green dots show hyper- and hypomethylation respectively. The dashed line shows a diagonal line. (c) Genome-wide distribution of hyper- or hypomethylated regions. Red bars indicate hypermethylated regions and green bars indicate hypomethylated regions. Circles indicate centromeres. (d) The distribution of the number of CpGs within hyper- or hypomethylated regions. (e) The distribution of the number of genes within hyper- or hypomethylated regions.
Figure 2
Figure 2
Hypermethylations are associated with CpG-rich and gene-related regions. (a) Pie chart representing the proportions of each genomic features of hyper- or hypomethylated CpGs. The repeats are not included when considering subsequent features. Promoters are defined as 10 kb regions from transcriptional start sites annotated in RefSeq database. (b) Distribution of the distance from transcription start sites to differentially methylated sites. CpG density is shown as a black line. Dotted lines show the ratio of hyper- or hypomethylated CpGs to CpG density. (c) Distribution of CpGo/e ratios surrounding CpGs covered in each MeDIP samples. (d) Distribution of CpGo/e ratios surrounding hyper- or hypomethylated CpGs in BCCs.
Figure 3
Figure 3
EMT-induced methylome alterations in MCF7. (a) Log scaled scatter plot displaying the association between the MeDIP/Input ratio of 100 kb segments in EMT-induced MCF7 and each cell lines. (b) Bar plot displaying the percentage of reads covering CGIs in EMT-induced or control MCF7. (c) The number of hyper- or hypomethylated CGIs gained or lost through EMT-induction in MCF7. (d) Bar plot displaying the percentage of hyper- or hypomethylated CpGs within each gene-related regions. (e) Distribution of CpGo/e surrounding CpGs, hyper- or hypomethylated through EMT. (f) Bar plot displaying the percentage of hyper- or hypomethylated CpGs within cell-type specifically methylated regions.

References

    1. Gardiner-Garden M, Frommer M. CpG islands in vertebrate genomes. J Mol Biol. 1987;196:261–282. doi: 10.1016/0022-2836(87)90689-9. - DOI - PubMed
    1. Clark SJ, Melki J. DNA methylation and gene silencing in cancer: which is the guilty party? Oncogene. 2002;21:5380–5387. doi: 10.1038/sj.onc.1205598. - DOI - PubMed
    1. Li E, Bestor TH, Jaenisch R. Targeted mutation of the DNA methyltransferase gene results in embryonic lethality. Cell. 1992;69:915–926. doi: 10.1016/0092-8674(92)90611-F. - DOI - PubMed
    1. Li E, Beard C, Jaenisch R. Role for DNA methylation in genomic imprinting. Nature. 1993;366:362–365. doi: 10.1038/366362a0. - DOI - PubMed
    1. Migeon BR. Concerning the role of X-inactivation and DNA methylation in fragile X syndrome. Am J Med Genet. 1992;43:182–187. doi: 10.1002/ajmg.1320430145. - DOI - PubMed

Publication types