

Analysis of chemotherapy response programs in ovarian cancers by the next-generation sequencing technologies
- PMID: 20181382
- PMCID: PMC2849907
- DOI: 10.1016/j.ygyno.2010.01.041
Analysis of chemotherapy response programs in ovarian cancers by the next-generation sequencing technologies
Abstract
Objective: To understand the chemotherapy response program in ovarian cancer cells at deep transcript sequencing levels.
Methods: Two next-generation sequencing technologies--MPSS (massively parallel signature sequencing) and SBS (sequencing by synthesis)--were used to sequence the transcripts of IGROV1 and IGROV1-CP cells, and to sequence the transcripts of a highly chemotherapy responsive and a highly chemotherapy resistant ovarian cancer tissue.
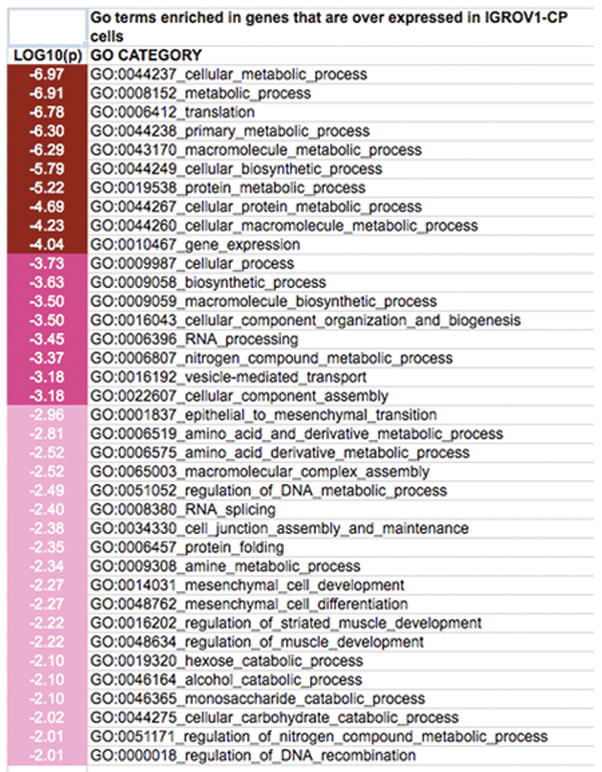
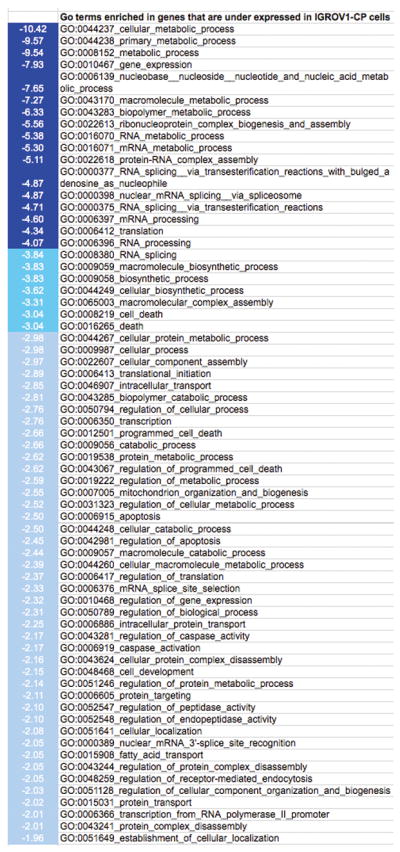
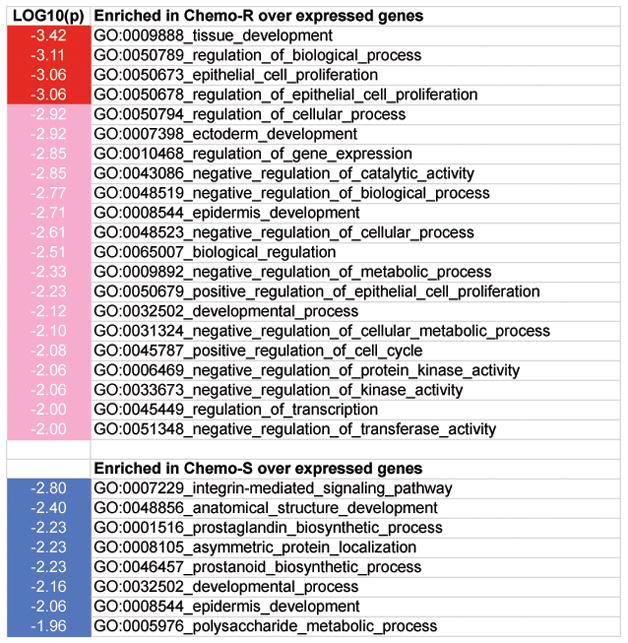
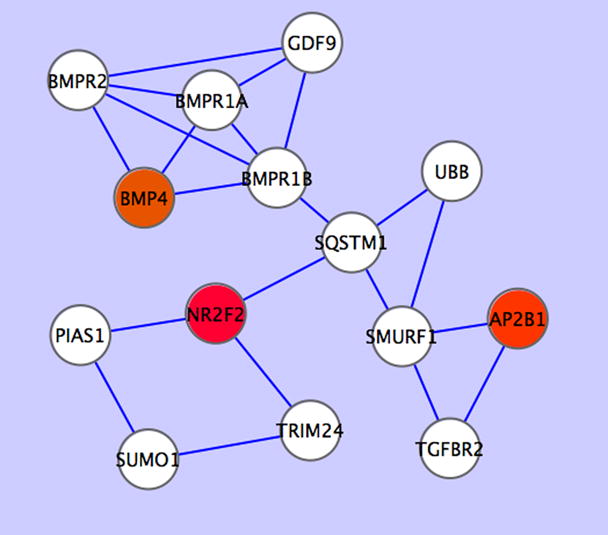
Results: We identified 3422 signatures (2957 genes) that are significantly different between IGROV1 and IGROV1-CP cells (P<0.001). Gene Ontology (GO) term GO:0001837 (epithelial-to-mesenchymal transition) and GO:0034330 (cell junction assembly and maintenance) are enriched in genes that are over expressed in IGROV1-CP cells while apoptosis-related GO terms are enriched in genes over expressed in IGROV1 cells. We identified 1187 tags (corresponding to 1040 genes) that are differentially expressed between the chemotherapy responsive and the persistently chemotherapy resistant ovarian cancer tissues. GO term GO:0050673 (epithelial cell proliferation) and GO:0050678 (regulation of epithelial cell proliferation) are enriched in the genes over expressed in the chemotherapy resistant tissue while the GO:0007229 (integrin-mediated signaling pathway) is enriched in the genes over expressed in the chemotherapy sensitive tissue. An integrative analysis identified 111 common differentially expressed genes including two bone morphogenetic proteins (BMP4 and BMP7), six solute carrier proteins (SLC10A3, SLC16A3, SLC25A1, SLC35B3, SLC7A5 and SLC7A7), transcription factor POU5F1 (POU class 5 homeobox 1), and KLK10 (kallikrein-related peptidase 10). A network analysis revealed a subnetwork with three genes BMP7, NR2F2 and AP2B1 that were consistently over expressed in the chemoresistant tissue or cells compared to the chemosensitive tissue or cells.
Conclusion: Our database offers the first comprehensive view of the digital transcriptomes of ovarian cancer cell lines and tissues with different chemotherapy response phenotypes.
Copyright (c) 2010 Elsevier Inc. All rights reserved.
Conflict of interest statement
The authors declare that there are no conflicts of interest.
Figures
References
-
- Clarke-Pearson DL. Clinical practice. Screening for ovarian cancer. N Engl J Med. 2009;361:170–7. - PubMed
-
- Ozols RF. Outcome issues in ovarian cancer. Oncology (Williston Park) 1995;9:135–9. - PubMed
-
- Ozols RF. Chemotherapy of ovarian cancer. Cancer Treat Res. 1998;95:219–34. - PubMed
-
- Brenner S, Johnson M, Bridgham J, Golda G, Lloyd DH, Johnson D, Luo S, McCurdy S, Foy M, Ewan M, Roth R, George D, Eletr S, Albrecht G, Vermaas E, Williams SR, Moon K, Burcham T, Pallas M, DuBridge RB, Kirchner J, Fearon K, Mao J, Corcoran K. Gene expression analysis by massively parallel signature sequencing (MPSS) on microbead arrays. Nat Biotechnol. 2000;18:630–4. - PubMed
-
- Lin B, White JT, Lu W, Xie T, Utleg AG, Yan X, Yi EC, Shannon P, Khrebtukova I, Lange PH, Goodlett DR, Zhou D, Vasicek TJ, Hood L. Evidence for the presence of disease-perturbed networks in prostate cancer cells by genomic and proteomic analyses: a systems approach to disease. Cancer Res. 2005;65:3081–91. - PubMed
Publication types
MeSH terms
Substances
Grants and funding
LinkOut - more resources
Full Text Sources
Other Literature Sources
Medical
Research Materials
Miscellaneous
