. 2010 Feb 24;30(8):2844-55.
doi: 10.1523/JNEUROSCI.5269-09.2010.

Critical involvement of postsynaptic protein kinase activation in long-term potentiation at hippocampal mossy fiber synapses on CA3 interneurons

Affiliations

Critical involvement of postsynaptic protein kinase activation in long-term potentiation at hippocampal mossy fiber synapses on CA3 interneurons

Emilio J Galván et al. J Neurosci. .

Abstract

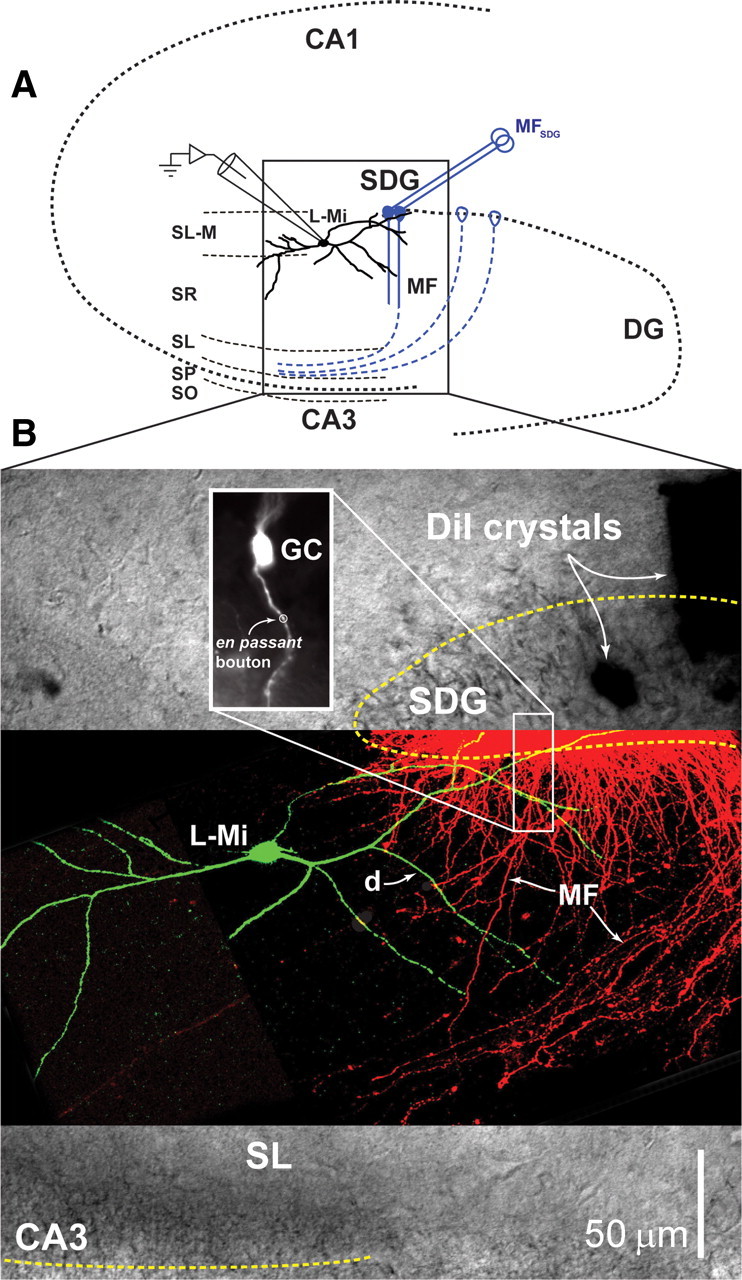
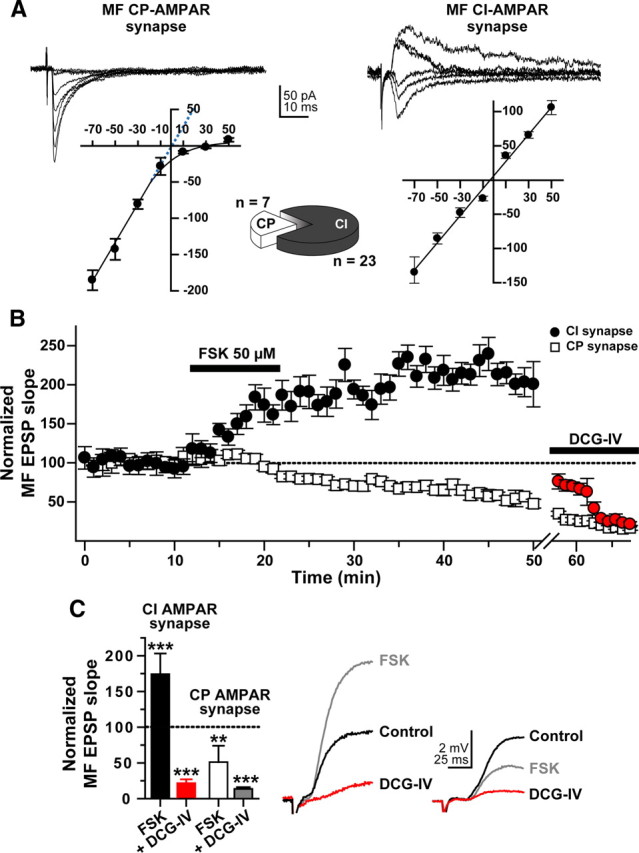
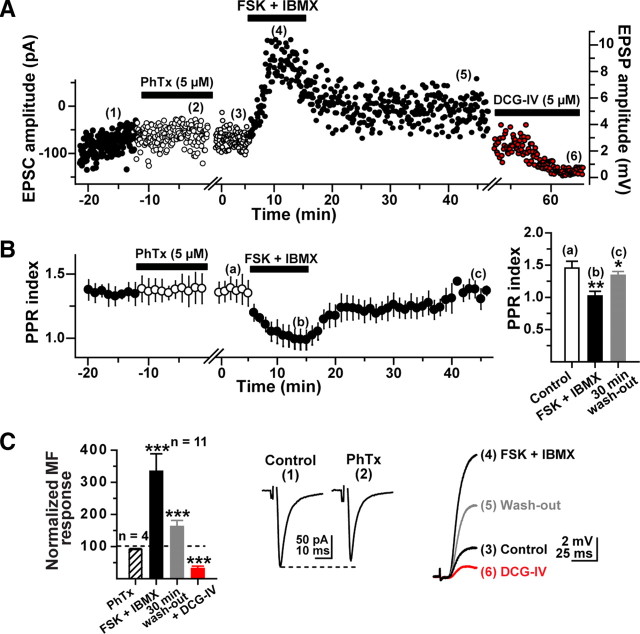
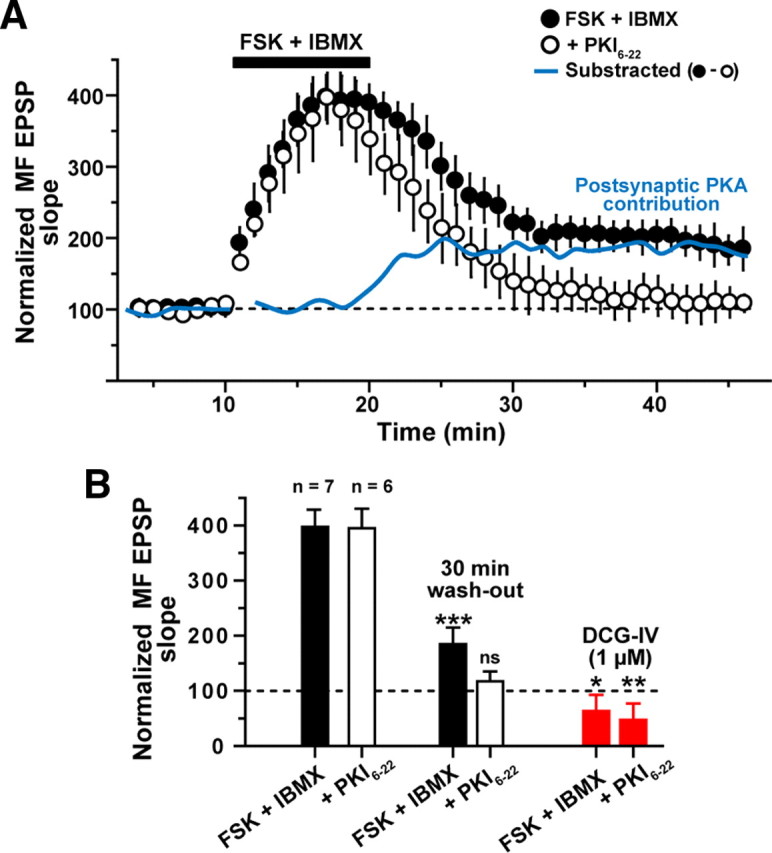
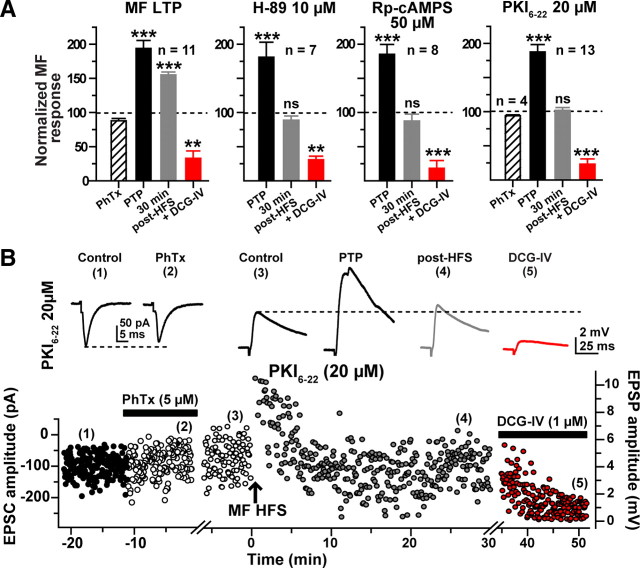
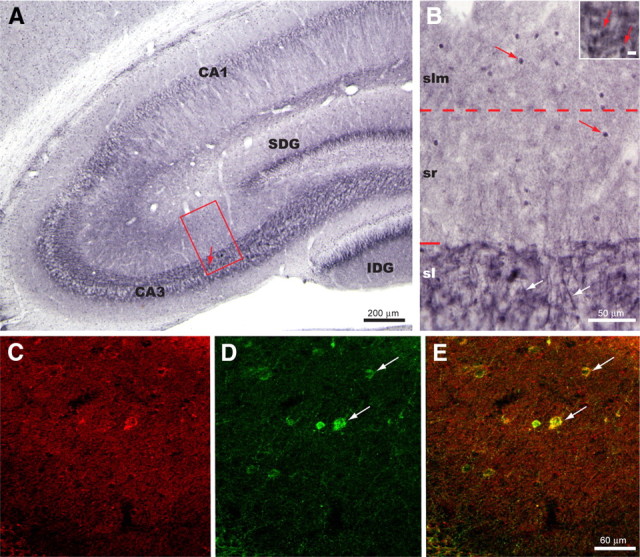
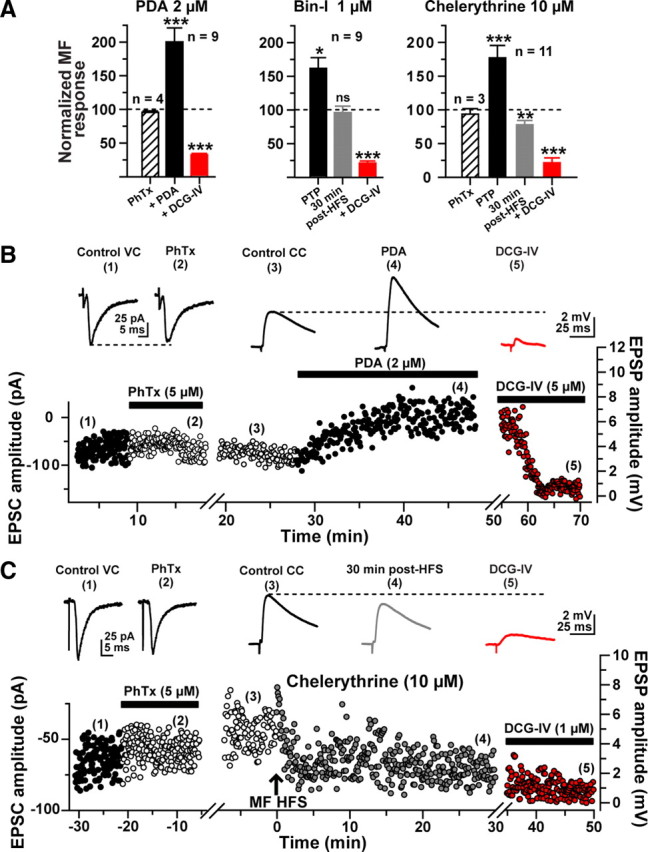
Hippocampal mossy fiber (MF) synapses on area CA3 lacunosum-moleculare (L-M) interneurons are capable of undergoing a Hebbian form of NMDA receptor (NMDAR)-independent long-term potentiation (LTP) induced by the same type of high-frequency stimulation (HFS) that induces LTP at MF synapses on pyramidal cells. LTP of MF input to L-M interneurons occurs only at synapses containing mostly calcium-impermeable (CI)-AMPA receptors (AMPARs). Here, we demonstrate that HFS-induced LTP at these MF-interneuron synapses requires postsynaptic activation of protein kinase A (PKA) and protein kinase C (PKC). Brief extracellular stimulation of PKA with forskolin (FSK) alone or in combination with 1-Methyl-3-isobutylxanthine (IBMX) induced a long-lasting synaptic enhancement at MF synapses predominantly containing CI-AMPARs. However, the FSK/IBMX-induced potentiation in cells loaded with the specific PKA inhibitor peptide PKI(6-22) failed to be maintained. Consistent with these data, delivery of HFS to MFs synapsing onto L-M interneurons loaded with PKI(6-22) induced posttetanic potentiation (PTP) but not LTP. Hippocampal sections stained for the catalytic subunit of PKA revealed abundant immunoreactivity in interneurons located in strata radiatum and L-M of area CA3. We also found that extracellular activation of PKC with phorbol 12,13-diacetate induced a pharmacological potentiation of the isolated CI-AMPAR component of the MF EPSP. However, HFS delivered to MF synapses on cells loaded with the PKC inhibitor chelerythrine exhibited PTP followed by a significant depression. Together, our data indicate that MF LTP in L-M interneurons at synapses containing primarily CI-AMPARs requires some of the same signaling cascades as does LTP of glutamatergic input to CA3 or CA1 pyramidal cells.


Figures

Figure 1.
Figure 1.
Selective activation of MF synapses onto the spineless dendrite of L-M interneurons. A, Schematic representation of the hippocampus slice preparation showing the position of the bipolar stimulating electrode (MFSDG) placed on the tip of the SDG and the whole-cell recording pipette in a L-M interneuron (L-Mi). The laminar diagram of the hippocampus identifies the CA1 and CA3 regions, the dentate gyrus (DG), the SDG, L-M, stratum radiatum (SR), stratum lucidum (SL), stratum pyramidale (SP), and stratum oriens (SO). B, Microscopic image of the cellular elements. A DIC image of the region identified by the box in A is overlaid with a confocal fluorescent image of a Lucifer yellow-filled L-M interneuron (L-Mi) and DiI-labeled granule cells projecting MFs from the SDG. The inset in the upper left shows an individual granule cell (GC) labeled with DiI, to highlight the presence of several putative en passant boutons along the mossy fiber projection (one of which is identified with a circle) as it courses through SL-M and SR layers of the hippocampus. The inset in the lower right is an enlargement of one region of crossing between mossy fiber axons (MF) and dendrites (d) of the L-M interneuron. In fact, the L-M interneuron dendrites extend across the MF projection at several positions (ranging from close to the SDG to near the SL).
Figure 2.
Figure 2.
Forskolin induces MF potentiation only at predominantly CI-AMPAR synapses on L-M interneurons. All experiments were performed in the presence of bicuculline (10 μm) and d-AP5 (50 μm). A, Representative current–voltage (I–V) relationship for rectifying CP-AMPAR MF synapses (left traces) and nonrectifying CI-AMPAR MF synapses (right traces) found in L-M interneurons of area CA3. The scatter plot in the left panel shows the rectification characteristic of CP-AMPAR-mediated responses. The dotted blue line in this plot is an extrapolation of the linear regression drawn through the data points between −70 mV and −10 mV to demonstrate that in the absence of rectification, the currents would reverse near 0 mV. The scatter plot in the right panel demonstrates the linearity characteristic of CI-AMPAR-mediated responses, and a reversal near 0 mV. Five EPSCs were evoked at each potential, from −70 mV to +50 mV (20 mV increments) and averaged. Pie chart shows the proportion of CP- and CI-AMPAR responses identified with either AMPAR I–V curves or Philanthotoxin (5 μm). B, Time course profile of normalized slopes of MF-evoked L-M interneuron EPSPs for CP- (open squares) and CI-AMPAR responses (filled circles) to bath application of FSK (50 μm; bar represents the period of drug application, 10 min). Response reduction upon bath application of DCG-IV (5 μm) near the end of the recording period confirms the MF origin of the recorded responses. C, Bar graph summarizing the effect of FSK on the slope of the MF-evoked L-M interneuron EPSP mediated by either CI-AMPARs (filled bar) or CP-AMPARs (open bar) recorded 30 min after FSK wash-out. The 10 min application of FSK induced MF potentiation at all CI-AMPAR synapses (n = 6), whereas synapses containing CP-AMPAR underwent MF depression (n = 3). The effect of DCG-IV on the respective responses is shown as well (red and gray bar, respectively). **p < 0.01; ***p < 0.001 or higher statistical significance. Error bars indicate SEM. Right panel shows representative traces from a CI-AMPAR synapse and a CP-AMPAR synapse.
Figure 3.
Figure 3.
The simultaneous inhibition of phosphodiesterases and stimulation of adenylyl cyclase induces potentiation of predominantly CI-AMPAR MF synapses on L-M interneurons. A, Representative experiment showing the time course of the amplitude of MF-evoked EPSCs before PhTx (1), during PhTx (2), after PhTx during baseline recording in current-clamp mode (3), during the combined application of FSK + IBMX (4), 30 min after drug wash-out (4), and during DCG-IV (5). Each circle represents a single EPSC (0.3 Hz) or EPSP (0.2 Hz). First break in the time axis represents the switch from voltage-clamp to current-clamp mode. MF EPSCs were weakly (<8%) sensitive to PhTx (5 μm), and MF EPSPs remained potentiated at least 30 min after the removal of FSK + IBMX. B, Paired-pulse facilitation (paired-pulse ratio, PPR index) was monitored throughout the experiment. PhTx did not alter the PPR in voltage-clamp mode. However, the PPR index decreased during bath-application of FSK + IBMX and partially recovered after wash-out of the drugs. Bars in the panel on the right summarize the PPR results at the time points indicated by the letters in the line graph on the left. C, Summary bar graph of MF-evoked responses during PhTx (n = 4), FSK + IBMX, wash-out, and DCG-IV (n = 11). Insets show representative traces (average of 10 sweeps) of MF-evoked EPSCs (center traces) and the initial phase of MF-evoked EPSPs (right traces) at the times indicated by the numbers in A. ***p < 0.001.
Figure 4.
Figure 4.
Temporal sequence of projected presynaptic and postsynaptic PKA contributions to MF potentiation. A, Time course of the normalized slope of MF-evoked EPSPs before, during, and after a 10 min application of IBMX + FSK (indicated by filled bar), as recorded either without (filled circles, n = 7) or with the PKA inhibitor PKI6-22 (20 μm; open circles, n = 6) in the patch-pipette. Application of FSK + IBMX induced an enhancement of the MF EPSP that in the absence of the PKA inhibitor persisted for at least 30 min after wash-out of the drugs. In cells loaded with PKI6-22, application of FSK + IBMX induced a similar enhancement that, however, failed to persist; the evoked response decayed to control levels within 15 min after wash-out of the drugs. The subtraction of the normalized values observed in the presence of FSK + IBMX without PKI6-22 minus FSK + IBMX with PKI6-22 in the patch-pipette (blue line) suggests a hypothetical time course for the requirement of postsynaptic PKA activity. The requirement for postsynaptic PKA activity appears to begin before the wash-out of drugs. B, Summary bar graph of MF-evoked responses during and 30 min after FSK + IBMX either without the PKA inhibitor (filled bars) or with PKI6-22 in the patch-pipette (open bars). MF origin of the EPSPs was confirmed by DCG-IV application at the end of the experiment (red bars). *p < 0.05, **p < 0.01, ***p < 0.001.
Figure 5.
Figure 5.
Postsynaptic blockade of PKA prevents LTP at MF synapses on L-M interneurons. A, Bar graphs summarizing MF-evoked responses after delivery of HFS (3 trains with 100 pulses at 100 Hz, delivered with a 10 s intertrain interval) to the MFs. LTP was induced successfully at CI-AMPAR synapses on L-M interneurons (left panel). When slices were incubated (45 min to 60 min) with the PKA inhibitor H-89, LTP was abolished. In cells loaded with either Rp-cAMPs (50 μm), a membrane-permeable inhibitor of PKA activation, or PKI6-22 (20 μm), a membrane-impermeable inhibitor of PKA, a normal level of PTP was preserved but MF LTP failed to develop. For the case of cells loaded with PKI6-22, the CI AMPAR component of the response was isolated using PhTx (5 μm). All the responses recorded were sensitive to DCG-IV (1 μm). **p < 0.01, ***p < 0.001. B, Recordings from a representative experiment in which the patch-pipette was loaded with PKI6-22 (20 μm). Time course of the amplitude of MF-evoked EPSCs or EPSPs before PhTx (1), during PhTx (2), during baseline in current-clamp mode (3), 30 min after HFS (4), and during DCG-IV (5). Each circle represents the amplitude value from a single EPSC (0.3 Hz) or EPSP (0.2 Hz). First break in the time axis represents the switch from voltage-clamp to current-clamp mode. MF-evoked EPSCs were weakly (<5%) sensitive to PhTx (5 μm), and LTP was blocked as a result of loading of the postsynaptic cell with PKI6-22. Traces (average of 10 sweeps) show representative responses at the times indicated by the numbers in the line graph.
Figure 6.
Figure 6.
Localization of PKA immunoreactivity within the dorsal hippocampus is illustrated in the coronal plane. A, Immunoreactivity was observed consistently within the apical dendrites of pyramidal cells in areas CA3 and CA1, within the MF pathway of the stratum lucidum (sl), and within interneurons present within strata radiatum (sr) and lacunosum moleculare (slm). The arrow in boxed area identifies the location of the high-magnification inset of B. SDG = suprapyramidal blade of dentate gyrus; IDG = infrapyramidal layer of dentate gyrus. B, Boxed area in A, presented at a higher magnification to illustrate to the best advantage the distribution pattern of PKA immunoreactivity shown in A. Immunopositive apical dendrites of pyramidal neurons (white arrows) can be seen passing through stratum lucidum. Densely stained large varicosities with a distribution and size similar to that observed for mossy fiber boutons were also evident in stratum lucidum (red arrows of inset; marker bar = 10 μm). Immunopositive interneurons are present within both sr and slm but are most prevalent within slm. C–E, Immunofluorescence localizations revealed that interneurons within sr and slm colocalized PKA and GAD. C and D illustrate immunofluorescence localization of PKA (C) and GAD (D) in the same field. Merger of the confocal images shown in E reveals that PKA and GAD immunoreactivity are colocalized in a subset of these sr and slm interneurons (white arrows). Whereas the PKA signal was detected primarily in the nuclear compartment in our immunohistochemical experiments, its appearance was stronger in the cytosol in our immunofluorescent studies. This difference in subcellular detection is likely related to methodological differences between the two types of study.
Figure 7.
Figure 7.
Postsynaptic PKC activity is required for LTP at MF synapses on L-M interneurons. A, Bar graphs summarizing the effect of the phorbol ester phorbol 12,13-diacetate (PDA; 2 μm) on the slope of MF-evoked EPSPs (left); the effect of preincubation (45 min to 1 h) with the PKC inhibitor bisindolylmaleimide I (Bin-I, 1 μm) on LTP induced by delivery of HFS to the MF (center); and the effect of loading of the postsynaptic cell with the PKC inhibitor chelerythrine (10 μm) on MF-induced LTP of the CI-AMPAR component (right). B, Representative experiment showing the time course of the amplitude of MF-evoked EPSCs or EPSPs before PhTx (1), during PhTx (2), during baseline in current-clamp mode (3), during PDA (4), and during DCG-IV (5). Each circle represents a single EPSC (0.3 Hz) or EPSP (0.2 Hz). First break in the time axis represents the switch from voltage-clamp to current-clamp mode. C, Representative experiment showing the CI-AMPAR-mediated component of the EPSC recorded from a typical L-M interneuron. MF-evoked EPSCs were weakly (<5%) sensitive to PhTx (5 μm; n = 3), and LTP was blocked as a result of loading of the postsynaptic cell with the PKC inhibitor chelerythrine. The effect of bath application of DCG-IV (1 μm) confirmed the MF-evoked nature of the recorded responses. Insets are representative traces obtained at the time indicated by the numbers.

Similar articles

Cited by

References

    1. Acsády L, Kamondi A, Sík A, Freund T, Buzsáki G. GABAergic cells are the major postsynaptic targets of mossy fibers in the rat hippocampus. J Neurosci. 1998;18:3386–3403. - PMC - PubMed
    1. Alle H, Jonas P, Geiger JR. PTP and LTP at a hippocampal mossy fiber-interneuron synapse. Proc Natl Acad Sci U S A. 2001;98:14708–14713. - PMC - PubMed
    1. Artola A, Singer W. Long-term depression of excitatory synaptic transmission and its relationship to long-term potentiation. Trends Neurosci. 1993;16:480–487. - PubMed
    1. Ascoli GA, Brown KM, Calixto E, Card JP, Galván EJ, Perez-Rosello T, Barrionuevo G. Quantitative morphometry of electrophysiologically identified CA3b interneurons reveals robust local geometry and distinct cell classes. J Comp Neurol. 2009;515:677–695. - PMC - PubMed
    1. Bear MF, Cooper LN, Ebner FF. A physiological basis for a theory of synapse modification. Science. 1987;237:42–48. - PubMed

Publication types

MeSH terms

LinkOut - more resources