. 2010 Feb 24;30(8):2856-70.
doi: 10.1523/JNEUROSCI.4222-09.2010.

Reconciling coherent oscillation with modulation of irregular spiking activity in selective attention: gamma-range synchronization between sensory and executive cortical areas

Affiliations

Reconciling coherent oscillation with modulation of irregular spiking activity in selective attention: gamma-range synchronization between sensory and executive cortical areas

Salva Ardid et al. J Neurosci. .

Abstract

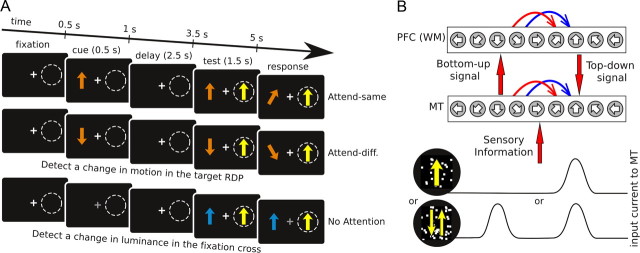
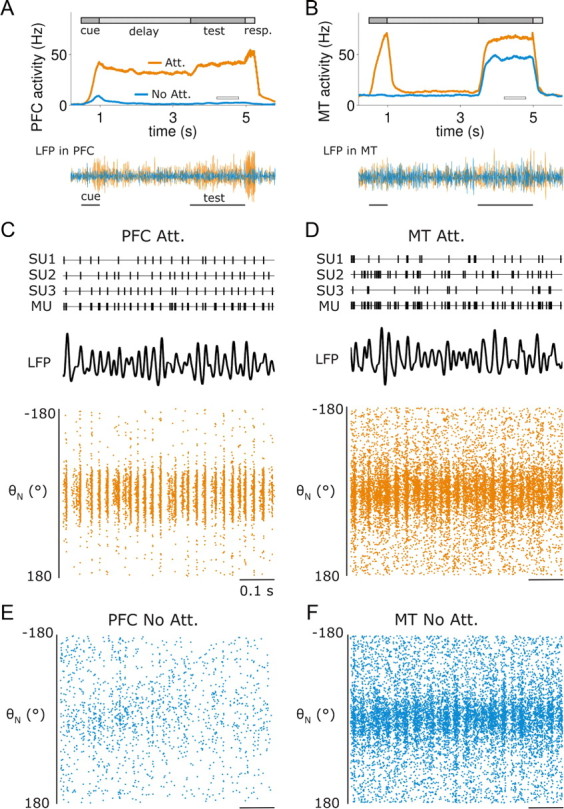
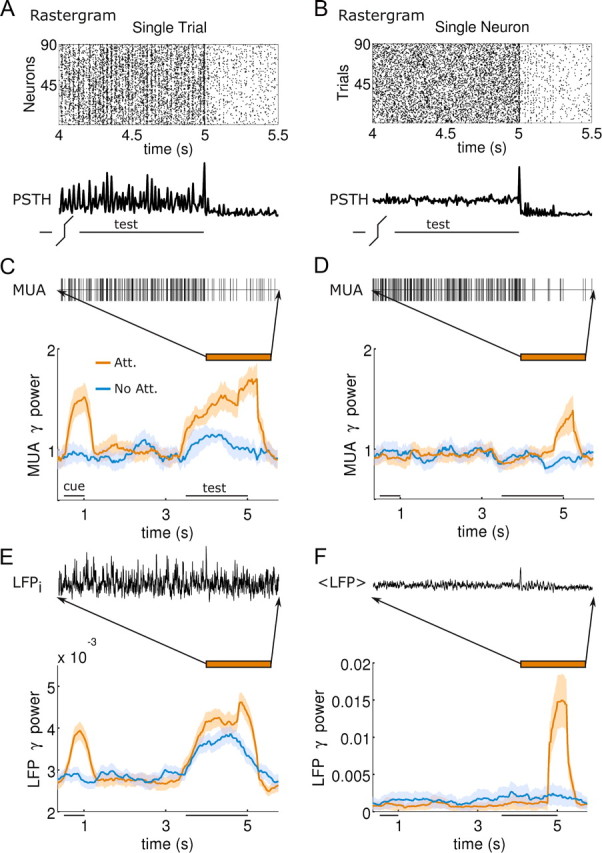
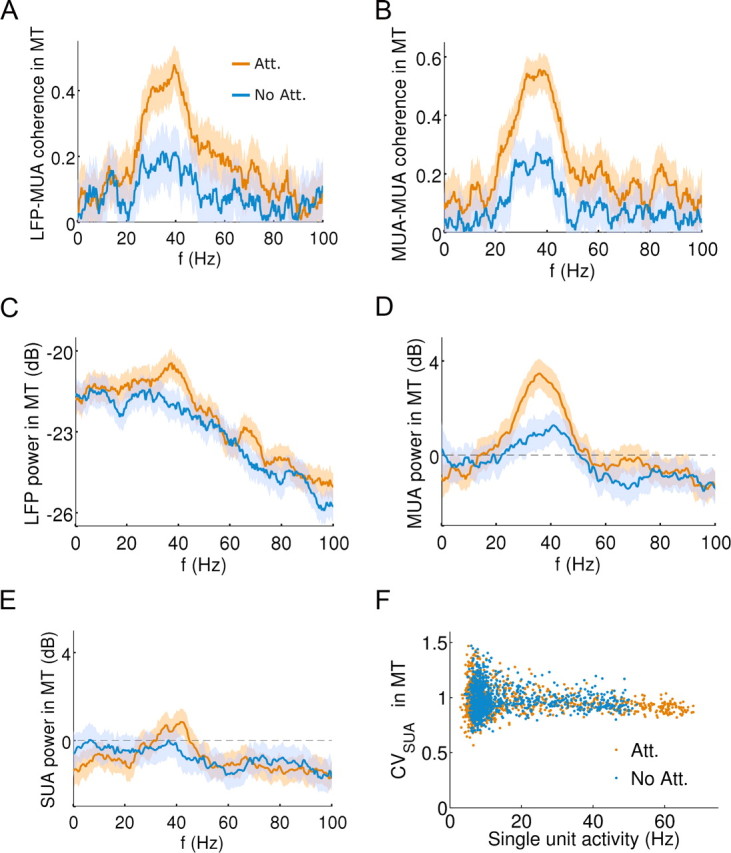
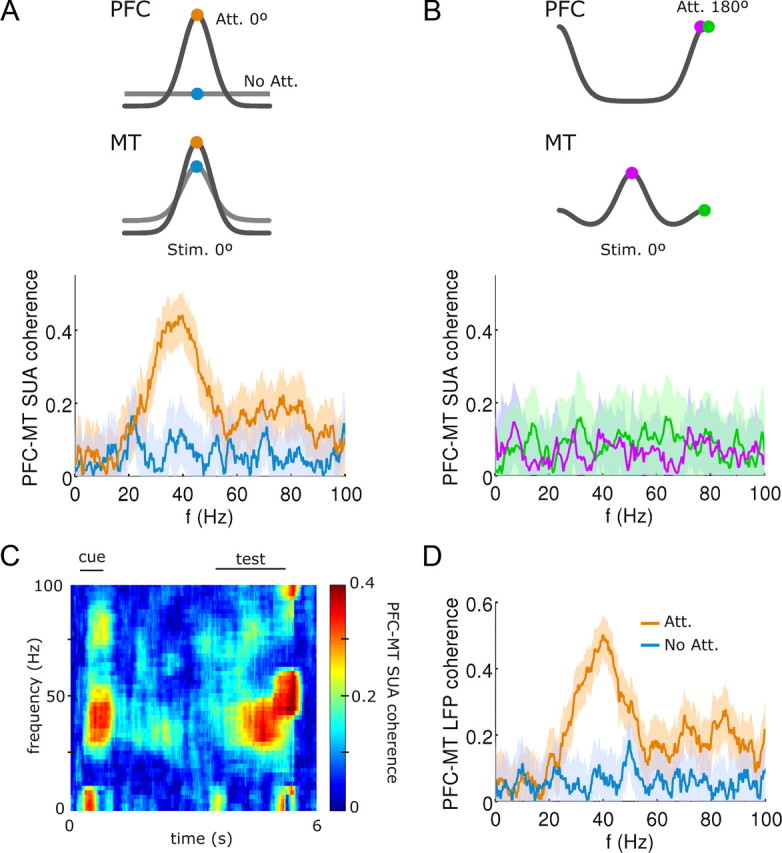
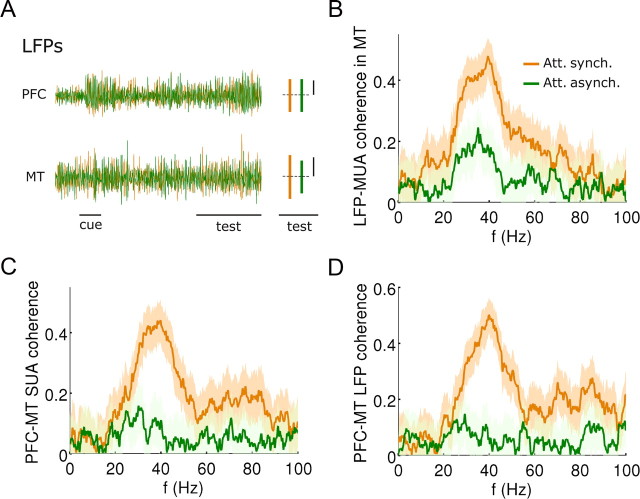
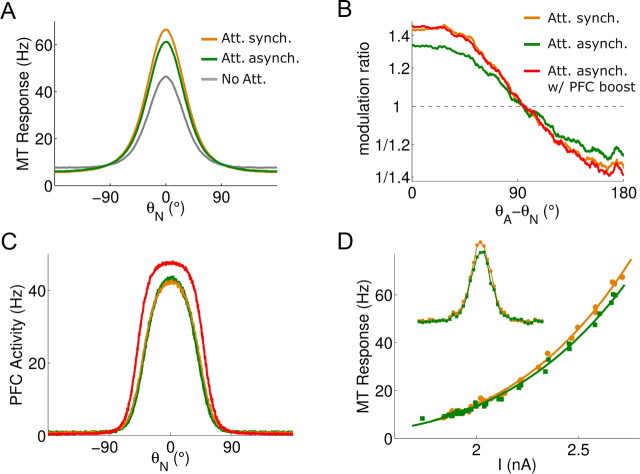
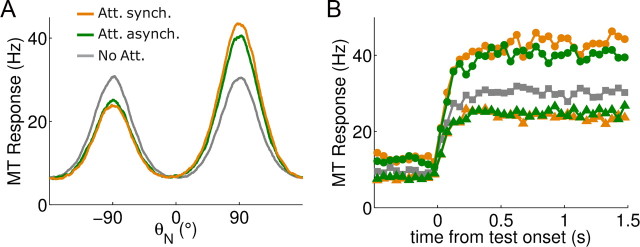
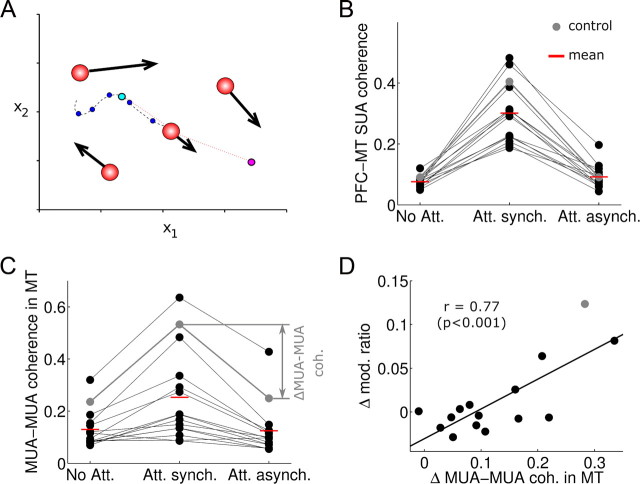
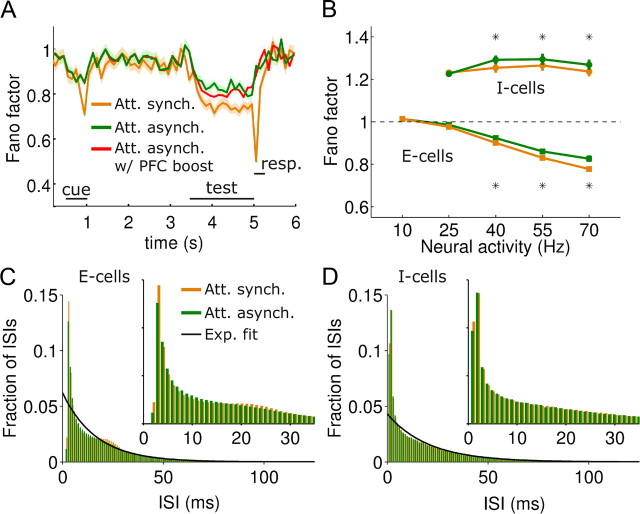
In this computational work, we investigated gamma-band synchronization across cortical circuits associated with selective attention. The model explicitly instantiates a reciprocally connected loop of spiking neurons between a sensory-type (area MT) and an executive-type (prefrontal/parietal) cortical circuit (the source area for top-down attentional signaling). Moreover, unlike models in which neurons behave as clock-like oscillators, in our model single-cell firing is highly irregular (close to Poisson), while local field potential exhibits a population rhythm. In this "sparsely synchronized oscillation" regime, the model reproduces and clarifies multiple observations from behaving animals. Top-down attentional inputs have a profound effect on network oscillatory dynamics while only modestly affecting single-neuron spiking statistics. In addition, attentional synchrony modulations are highly selective: interareal neuronal coherence occurs only when there is a close match between the preferred feature of neurons, the attended feature, and the presented stimulus, a prediction that is experimentally testable. When interareal coherence was abolished, attention-induced gain modulations of sensory neurons were slightly reduced. Therefore, our model reconciles the rate and synchronization effects, and suggests that interareal coherence contributes to large-scale neuronal computation in the brain through modest enhancement of rate modulations as well as a pronounced attention-specific enhancement of neural synchrony.


Figures

Figure 1.
Figure 1.
Schematic description of simulated task and model architecture. A, The simulated task consisted of various task epochs (columns) and trial types (rows). In attention trials (top two rows) a cue stimulus is presented, indicating the motion direction of the stimulus to be attended. After a delay period without any motion stimulation, the target and test stimuli appear on the screen outside and inside the receptive field, respectively. The direction of motion of the test stimulus can match the attended target direction (top row) or not (middle row). B, Scheme of the model architecture (red is excitation, blue is inhibition). Each of the two circuits includes excitatory pyramidal cells and inhibitory interneurons (not shown in scheme). The MT circuit contains neurons selective for the same receptive field and are differentially selective to motion direction. Neurons in the PFC circuit are also selective to motion direction but not to spatial location. Local connections within each circuit and cross-areal connections between excitatory cells depend on their respective preferred stimulus features (motion stimulus direction). Top-down projection from the working memory (WM) circuit targets both excitatory and inhibitory cells in the sensory circuit. Two kinds of random-dot motion stimuli are considered (yellow arrows signal motion directions): single (top input current) and transparent (bottom input current) motion.
Figure 2.
Figure 2.
Network oscillations emerge in two-area loop model. A, Top, Average firing rate of a PFC neuron selective to the test stimulus. The PFC neuron activated only in attention trials, from cue onset, through delay until the response period. Bottom traces, Bandpass filtered LFPs (20–70 Hz) for the two attentional conditions. Attentional LFP amplitude increase reveals local synchrony enhancement at gamma frequencies. B, Same for a neuron from the MT network, also selective to the test stimulus. The MT neuron activated during cue and test in attention trials and only during the test in nonattention trials, when no cue was presented. C, Dynamics of 3 single units (SU), multiunit (MU, pooled spikes from top SUs), LFP (bandpass filtered 20–70 Hz), and spatiotemporal graph of spiking activity (bottom) in the PFC area network in a fragment of the test period (white horizontal bar in A) and in the attended condition. D, Same for MT network. E, Spatiotemporal graph of network spiking activity in the nonattention condition and in the test period for the PFC network. F, Same for MT network.
Figure 3.
Figure 3.
Attentional synchrony enhancement in MT is not phase locked to stimulus, but to response. A, Spike-time rasters of 90 neurons (y-axis) in time (x-axis) in a single trial, and their PSTH (below) show clear gamma oscillations. B, This oscillatory regime is not revealed in the spike-time rasters or PSTH of a single neuron in 90 different stimulus-aligned trial simulations (y-axis). C, MUA formed by collapsing spikes from 3 adjoint neurons in A shows different gamma-range spectral power (average power in 30–50 Hz normalized to MUA firing rate) during stimulus presentation for attention (orange) and nonattention (blue) trials (Nt = 20). D, Same analysis for MUA formed from the spiking activity of a neuron in 3 consecutive trials fails to show attentional gamma enhancement during test stimulus, but it emerges during response. E, Gamma power spectrum (see C) of LFP (sample LFP above) averaged over 70 simulations shows gamma enhancement during stimulus and response. F, Gamma power spectrum of average LFP (LFP averaged over 70 trials, above) does not show attentional enhancement during stimulus, as oscillations are not phase locked to stimulus, but shows it during response, indicating phase locking of gamma to response onset.
Figure 4.
Figure 4.
Gamma band oscillations are detected locally in both networks. A, Average coherence between the LFP and MUA in MT increases in the gamma-range for attention (orange) relative to nonattention (blue) trials during test stimulus presentation (Nt = 20). B, Same between neighboring MUAs in MT. C, The power spectrum of the LFP reveals a gamma peak enhancement in attended trials (orange) relative to nonattended trials (blue). D, Synchrony enhancement in spike train power spectra remains by constructing a MUA with 3 neighboring SUA (Nt = 20). E, Averaged power spectrum of MT test-period SUA does not show significant synchrony enhancement (Nt = 20). F, Coefficients of variation (CVs) for the excitatory MT neuron population remain very high (≈1) both in attention (orange) and nonattention (blue) trials. CV data for the 1024 neurons comes from the 1.5 s test period in a single simulation.
Figure 5.
Figure 5.
Coherent neuronal activity between PFC and MT in the gamma band occurs selectively and only in attention trials. A, Trial-averaged (Nt = 20) coherence between spikes from one PFC neuron and one MT neuron [selected at θcenter ≈ 0° (see Materials and Methods), circles in the top scheme] shows gamma-range enhancement during attention-to-test (orange) relative to nonattention (blue) trials. B, In contrast to A, no gamma-range effect is observed when the test stimulus was orthogonal to the attended stimulus, both when taking neurons with similar selectivity (green, see top scheme) or with distant selectivity and maximal response (violet, see top scheme) in either network. C, Temporally resolved PFC–MT SUA coherence analysis through an attention trial shows strong gamma coherence during cue, test, and response periods. D, Averaged coherence between local field potentials at θcenter ≈ 0° (see Materials and Methods) in the two networks mimics results in A.
Figure 6.
Figure 6.
Random conduction latencies in the top-down signal disrupt selectively gamma band synchronization between the two networks. A, Sample gamma-band filtered LFP signals (20–70 Hz) from the PFC and MT networks in the control attention case (orange) and in the case with randomly dispersed top-down synaptic latencies of SD 100 ms (green). Bar plots to the right of LFP traces represent the SD of LFP signals during the test period in each condition, and show that top-down latencies affect LFP fluctuations in MT but not in PFC. B, Gamma coherence between MUA and LFP signals from the MT network drops after introduction of random synaptic latencies of SD 100 ms in the top-down connection (before = orange, after = green) (computed as in Fig. 4A). C, Same for the SUA–SUA coherence between MT and PFC (computed as in Fig. 5A). D, Same for LFP-LFP coherence between networks (computed as in Fig. 5D).
Figure 7.
Figure 7.
Gamma band synchronization between PFC and MT specifically enhances the firing rate effects attributed to selective visual attention, in a similar way as PFC rate increases. A, Trial-averaged (Nt = 20) population activity during the test period in attention (orange), nonattention (gray), and random top-down latencies (green) cases. Attention enhances selectivity, and interareal gamma band synchronization contributes. B, Modulation ratios [i.e., point-by-point division of attentional rates by nonattentional rates (Martinez-Trujillo and Treue, 2004) in A] are accentuated in the control case (orange) relative to the case with asynchronous top-down input (green). Attentional modulation is recovered when, in addition, PFC neurons receive external injected current (red). C, PFC activity for the cases depicted in B. Activity is boosted by external current injection (red), and this results in a recovered modulation ratio through asynchronous top-down signal in B. D, Interareal synchronization increases the exponent of the power-law relationship between MT neuron activity and input (I = IS + IA). The exponent increases from 3.79 to 3.92. Inset, Tuning curves with interareal synchrony (orange) and without (green).
Figure 8.
Figure 8.
Gamma-range synchronization strengthens the attentional bias of network responses to multiple stimuli (transparent motion). A, Trial-averaged population activity in MT when two transparent motion components were simultaneously presented in the receptive field (Nt = 20), in the nonattended (gray), and attended with (green) and without (orange) random top-down latencies. Synchronized top-down inputs enhance attentional effects. Neurons are labeled on the x-axis according to their preferred direction (θN). B, The attentional bias is enhanced by interareal synchrony when attention is directed to the neuron's preferred direction of motion (circles, stimuli at 90° and −90°, neuron θN = 90°, attention at 90°; see A), and reduced when attention is focused to the neuron's null direction of motion (triangles, stimuli at 90° and −90°, neuron θN = −90°, attention at 90°; see A). The nonattention condition is plotted to observe the attentional bias magnitude (squares, stimuli at 90° and −90°, neuron θN = 90°; see A).
Figure 9.
Figure 9.
An automated optimization procedure found 14 additional MT networks, all of which showed little dependence of firing rate modulations on interareal synchronization. A, Simplified schematic representation of the optimization algorithm (particle swarm optimization). Each network configuration is determined by fixing 13 free parameters of the simulation, i.e., each network is represented by one “particle” in a 13-dimensional space. We represent here graphically an analogous bidimensional situation (parameters x1, x2). Several networks (typically 50, a “swarm”) are simulated in parallel (here 4 red particles). For one of the particles (center), a path with previously visited locations (dark blue dots) is drawn. The particle updates its velocity stochastically toward the location with best fitness value visited previously by this particle (cyan dot) and toward the best location found by the whole swarm (magenta dot). The fitness of a given location is determined by running 7 network simulations with the corresponding parameters for various stimuli conditions, and checking how well neural responses approach quantitatively experimental values for MT neurons in the literature (supplemental Methods, available at www.jneurosci.org as supplemental material). An optimization run finishes when the swarm converges to a global optimum. If the global optimum is not reached within 50 algorithm iterations, the optimization run is stopped and all particles are discarded. B, Interareal coherence is enhanced in attention trials, and abolished by top-down random latencies. Average maximal PFC–MT SUA coherence (mean in ±10 Hz from coherence peak) for each of 15 networks in three different conditions: nonattention trials (No Att.), attention trials (Att. synch.), and attention trials with random top-down conduction latencies (Att. Asynch.). The control network shown in previous figures is indicated in gray. C, Effects of attention in MT MUA–MUA coherence are abolished when introducing top-down random latencies. Average maximal MT–MT coherence (mean in ±10 Hz from coherence peak) for each of 15 networks in the three different conditions of B. The control network shown in previous figures is indicated in gray. D, The effects of top-down random latencies on MT–MT coherence (ΔMUA–MUA coh., indicated on C) and on changes in rate modulations of maximally activated neurons (modulation ratio averaged across neurons where θA − θN ∈ [0°, 45°]) correlate strongly across the population of 15 networks. Despite large changes in coherence (x-axis), firing rate modulations of coding populations are affected very modestly by interareal synchronization (y-axis).
Figure 10.
Figure 10.
Interareal synchronization reduces neuronal firing variability but Fano factors remain high, due to burstiness. A, Fano factor of high-rate MT neurons (averaged over 101 neurons around θN = 0°, see Materials and Methods) through the periods of the task for attention (orange), attention trials with top-down asynchronous input (green) and attention trials with top-down asynchronous input and PFC boost (red) (Fig. 7). The overlap of the red and green curves, for which test-period firing rates are identical (Fig. 7), demonstrates that interareal synchronization, not rate, was responsible for the attentional Fano factor modulation in the test period shown in A. Shaded regions indicate SEM over the 101 neurons considered. B, Fano factor versus binned firing rate for model neurons. At high rates, interareal synchronization had the effect of reducing the Fano factor (compare case with interareal synchrony, in orange, and case without, in green; stars indicate t test significance at p < 0.05). The Fano factor was calculated individually for each neuron, following the approach that is used experimentally (Mitchell et al., 2007) (see Materials and Methods). C, ISIHs (Nt = 128) for excitatory neurons of intermediate rates (neurons firing in the range 47–62 Hz) in attention trials (orange) and attention trials with top-down asynchronous input (green) (Fig. 6). Burstiness is reflected in the high first bins of the histogram (compare with expected Poisson histogram fit delineated in black). Oscillations appear as a small secondary peak at ∼23 ms for the attention trials. D, Same for inhibitory neurons. Oscillations are not observed.

Similar articles

Cited by

References

    1. Albright TD. Direction and orientation selectivity of neurons in visual area MT of the macaque. J Neurophysiol. 1984;52:1106–1130. - PubMed
    1. Ardid S, Wang X-J, Compte A. An integrated microcircuit model of attentional processing in the neocortex. J Neurosci. 2007;27:8486–8495. - PMC - PubMed
    1. Aston-Jones G, Cohen JD. An integrative theory of locus coeruleus-norepinephrine function: adaptive gain and optimal performance. Annu Rev Neurosci. 2005;28:403–450. - PubMed
    1. Bair W, Koch C, Newsome W, Britten K. Power spectrum analysis of bursting cells in area MT in the behaving monkey. J Neurosci. 1994;14:2870–2892. - PMC - PubMed
    1. Barbas H. Anatomic organization of basoventral and mediodorsal visual recipient prefrontal regions in the rhesus monkey. J Comp Neurol. 1988;276:313–342. - PubMed

Publication types

MeSH terms