. 2010 Feb 24;30(8):2960-6.
doi: 10.1523/JNEUROSCI.3730-10.2010.

Stimulus predictability reduces responses in primary visual cortex

Affiliations

Stimulus predictability reduces responses in primary visual cortex

Arjen Alink et al. J Neurosci. .

Abstract

In this functional magnetic resonance imaging study we tested whether the predictability of stimuli affects responses in primary visual cortex (V1). The results of this study indicate that visual stimuli evoke smaller responses in V1 when their onset or motion direction can be predicted from the dynamics of surrounding illusory motion. We conclude from this finding that the human brain anticipates forthcoming sensory input that allows predictable visual stimuli to be processed with less neural activation at early stages of cortical processing.


Figures

Figure 1.
Figure 1.
Stimuli presented during experiments 1 and 2. a, Schematic overview of the spatial layout of the stimuli presented during experiment 1. The top and bottom solid white bars represent the apparent-motion-inducing stimuli that were presented for 200 ms with an interstimulus interval of 150 ms. The empty bar represents the test stimulus that was presented for 16 ms during upward apparent motion, which occurred during the interstimulus interval following the presentation of the lower bar. b, A schematic space–time plot that illustrates the time of presentation of the test bar relative to linear apparent motion during experiment 1. The dotted line represents the trajectory of linear apparent motion between the top and bottom bars. For the predictable condition (top), the test stimulus is presented at the time at which linear apparent motion passes the location of the test bar (41.7 ms after the offset of the lower bar). For the unpredictable condition (bottom), the test bar is presented at the same location but with a greater delay than the predictable test bar (108 ms after the offset of the bottom bar), which corresponds to the time at which linear apparent motion already passed the location of the test bar stimulus. c, A schematic depiction of the stimuli presented during experiment 2. Apparent-motion stimuli were identical to those presented in experiment 1 although they were slightly smaller. During the interstimulus intervals, random-dot motion was presented on the path of apparent motion. The motion direction of these dots was either parallel to the apparent motion or 30, 60, or 90° anticlockwise from the apparent-motion direction.
Figure 2.
Figure 2.
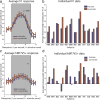
a, c, The grand mean event-related BOLD responses for experiment 1 generated using deconvolution for the regions of interest representing the test bar in V1 (a) and hMT/V5+ (c). Event-related responses are shown for predictable trials (blue) and unpredictable trials (red). b, d, Individual BOLD response peak amplitudes for the regions of interest V1 (b) and hMT/V5+ (d) expressed by the mean of the data points 4–12 for predictable (blue) and unpredictable (red) trials.
Figure 3.
Figure 3.
Left, The grand-mean event-related BOLD responses for experiment 2 generated using deconvolution for the regions of interest representing the moving dots in V1 (top) and hMT/V5+ (bottom). Event-related responses are shown for motion that runs parallel to the apparent-motion direction as well as responses to motion deviating 30, 60, and 90° anticlockwise from the apparent-motion direction. Right, Pearson correlation plots illustrating the positive correlation between the deviation of the random-dot motion direction from the apparent-motion direction and BOLD response amplitudes (average of data points 4–12) in V1 (top) and hMT/V5+ (bottom).

Comment in

References

    1. Ahmed B, Hanazawa A, Undeman C, Eriksson D, Valentiniene S, Roland PE. Cortical dynamics subserving visual apparent motion. Cereb Cortex. 2008;18:2796–2810. - PMC - PubMed
    1. Alink A, Singer W, Muckli L. Capture of auditory motion by vision is represented by an activation shift from auditory to visual motion cortex. J Neurosci. 2008;28:2690–2697. - PMC - PubMed
    1. Angelucci A, Bressloff PC. Contribution of feedforward, lateral and feedback connections to the classical receptive field center and extra-classical receptive field surround of primate V1 neurons. Prog Brain Res. 2006;154:93–120. - PubMed
    1. Angelucci A, Bullier J. Reaching beyond the classical receptive field of V1 neurons: horizontal or feedback axons? J Physiol Paris. 2003;97:141–154. - PubMed
    1. Bar M. The proactive brain: using analogies and associations to generate predictions. Trends Cogn Sci. 2007;11:280–289. - PubMed

Publication types

MeSH terms