

In vivo intracellular recording suggests that gray matter astrocytes in mature cerebral cortex and hippocampus are electrophysiologically homogeneous
- PMID: 20181606
- PMCID: PMC6633951
- DOI: 10.1523/JNEUROSCI.5065-09.2010
In vivo intracellular recording suggests that gray matter astrocytes in mature cerebral cortex and hippocampus are electrophysiologically homogeneous
Abstract
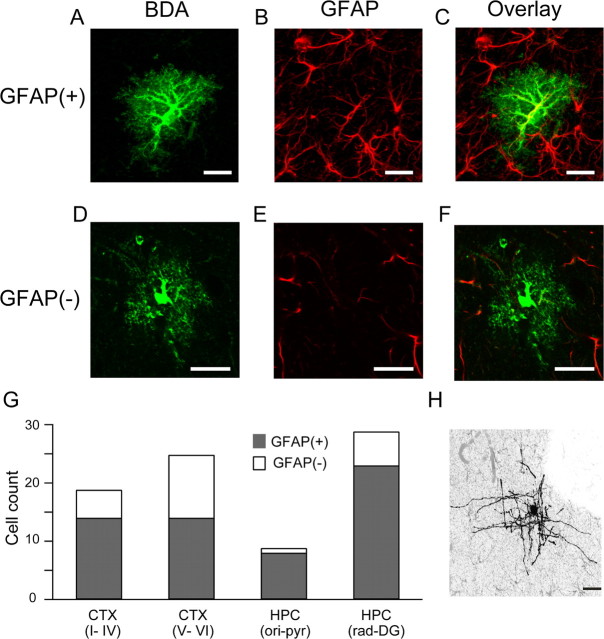
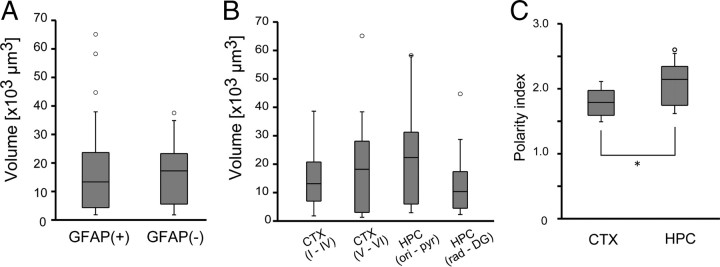
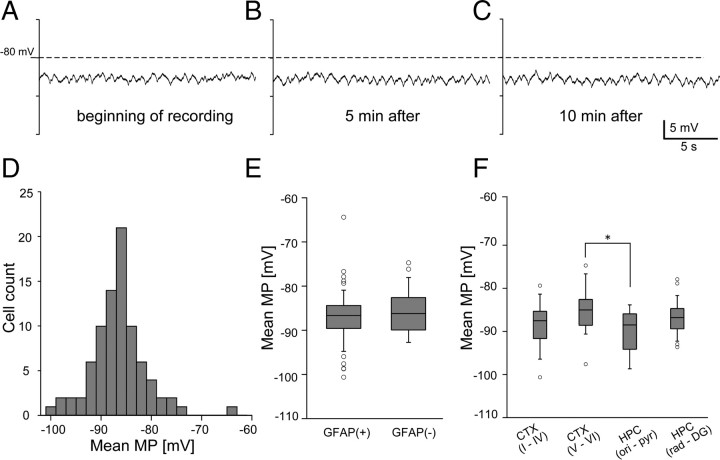
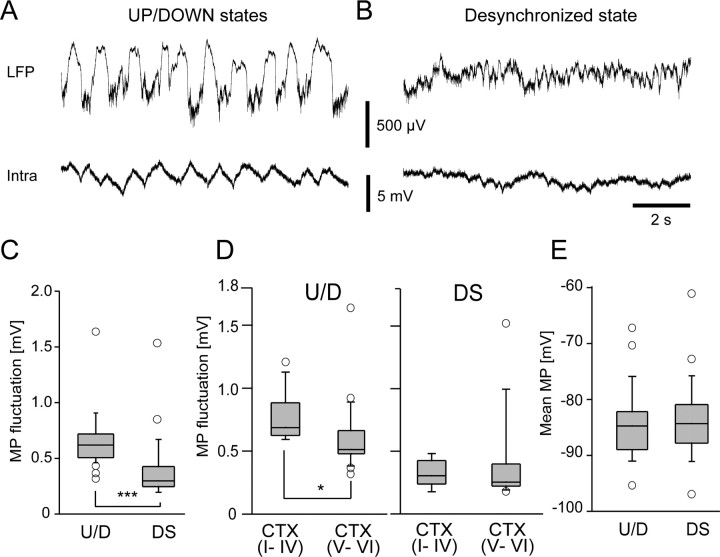
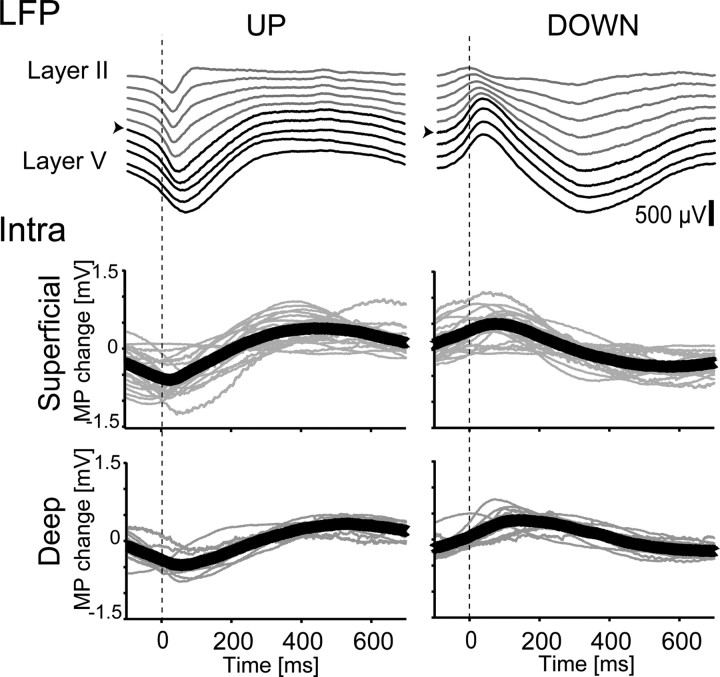
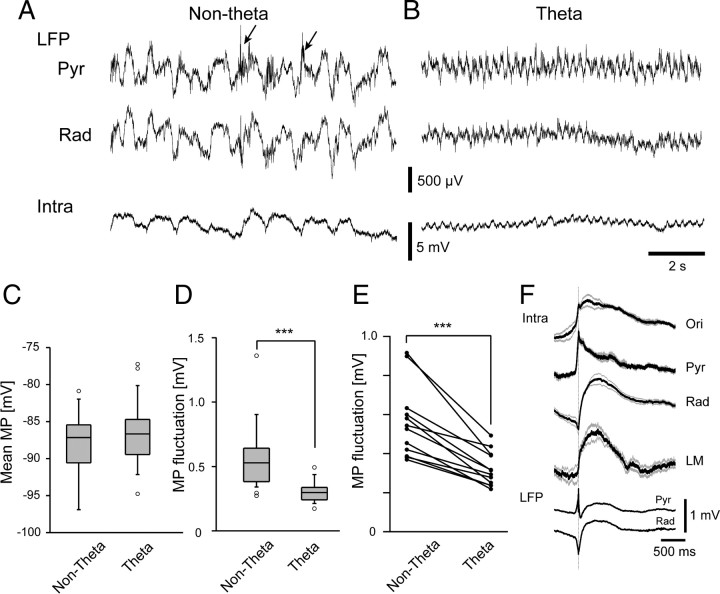
Previous anatomical and in vitro electrophysiology studies suggest that astrocytes are heterogeneous in physiology, morphology, and biochemical content. However, the extent to which this diversity applies to in vivo conditions is largely unknown. To characterize and classify the physiological and morphological properties of cerebral cortical and hippocampal astrocytes in the intact brain, we performed in vivo intracellular recordings from single astrocytes using anesthetized mature rats. Astrocytes were classified based on their glial fibrillary acidic protein (GFAP) immunoreactivity and cell body locations. We analyzed morphometric measures such as the occupied volume and polarity, as well as physiological characteristics such as the mean membrane potential. These measurements did not show obvious segregation into subpopulations, suggesting that gray matter astrocytes in the cortex and hippocampus are composed of a homogeneous population in mature animals. The membrane potential of astrocytes in both cortex and hippocampus fluctuated within a few millivolts in the presence of spontaneous network activity. These membrane potential fluctuations of an astrocyte showed a significant variability that depended on the local field potential state and cell body location. We attribute the variability of the membrane potential fluctuations to local potassium concentration changes due to neuronal activity.
Figures
Similar articles
-
Intracellular labeling of single cortical astrocytes in vivo.J Neurosci Methods. 2007 Oct 15;166(1):32-40. doi: 10.1016/j.jneumeth.2007.06.021. Epub 2007 Jul 1. J Neurosci Methods. 2007. PMID: 17686526
-
Functional specialization and topographic segregation of hippocampal astrocytes.J Neurosci. 1998 Jun 15;18(12):4425-38. doi: 10.1523/JNEUROSCI.18-12-04425.1998. J Neurosci. 1998. PMID: 9614220 Free PMC article.
-
A morphological and electrophysiological study on the postnatal development of oligodendrocyte precursor cells in the rat brain.Brain Res. 2008 Dec 3;1243:27-37. doi: 10.1016/j.brainres.2008.09.029. Epub 2008 Sep 19. Brain Res. 2008. PMID: 18824157
-
Considerations on the astroglial architecture and the columnar organization of the cerebral cortex.Cell Mol Neurobiol. 2002 Dec;22(5-6):633-44. doi: 10.1023/a:1021892521180. Cell Mol Neurobiol. 2002. PMID: 12585683 Free PMC article. Review.
-
Cerebral cortex astroglia and the brain of a genius: a propos of A. Einstein's.Brain Res Rev. 2006 Sep;52(2):257-63. doi: 10.1016/j.brainresrev.2006.03.002. Epub 2006 May 3. Brain Res Rev. 2006. PMID: 16675021 Free PMC article. Review.
Cited by
-
Neuroinflammation alters voltage-dependent conductance in striatal astrocytes.J Neurophysiol. 2012 Jul;108(1):112-23. doi: 10.1152/jn.01182.2011. Epub 2012 Mar 28. J Neurophysiol. 2012. PMID: 22457466 Free PMC article.
-
How do astrocytes shape synaptic transmission? Insights from electrophysiology.Front Cell Neurosci. 2013 Oct 1;7:159. doi: 10.3389/fncel.2013.00159. Front Cell Neurosci. 2013. PMID: 24101894 Free PMC article. Review.
-
Cortical energy demands of signaling and nonsignaling components in brain are conserved across mammalian species and activity levels.Proc Natl Acad Sci U S A. 2013 Feb 26;110(9):3549-54. doi: 10.1073/pnas.1214912110. Epub 2013 Jan 14. Proc Natl Acad Sci U S A. 2013. PMID: 23319606 Free PMC article.
-
Versatile and simple approach to determine astrocyte territories in mouse neocortex and hippocampus.PLoS One. 2013 Jul 23;8(7):e69143. doi: 10.1371/journal.pone.0069143. Print 2013. PLoS One. 2013. PMID: 23935940 Free PMC article.
-
Morphological Features of Astrocytes in Health and Neuropsychiatric Disorders.Adv Neurobiol. 2021;26:75-92. doi: 10.1007/978-3-030-77375-5_4. Adv Neurobiol. 2021. PMID: 34888831 Review.
References
-
- Amzica F, Massimini M. Glial and neuronal interactions during slow wave and paroxysmal activities in the neocortex. Cereb Cortex. 2002;12:1101–1113. - PubMed
-
- Bakiri Y, Attwell D, Káradóttir R. Electrical signalling properties of oligodendrocyte precursor cells. Neuron Glia Biol. 2009;13:1–9. - PubMed
Publication types
MeSH terms
Substances
LinkOut - more resources
Full Text Sources
Miscellaneous