

Development of monozygotic twin mouse embryos from the time of blastomere separation at the two-cell stage to blastocyst
- PMID: 20181620
- PMCID: PMC2874505
- DOI: 10.1095/biolreprod.109.082982
Development of monozygotic twin mouse embryos from the time of blastomere separation at the two-cell stage to blastocyst
Abstract
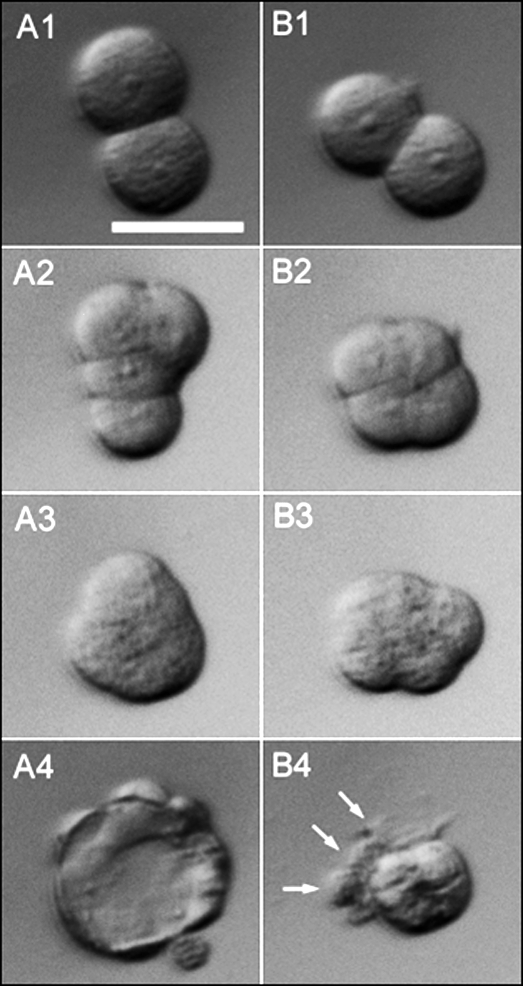
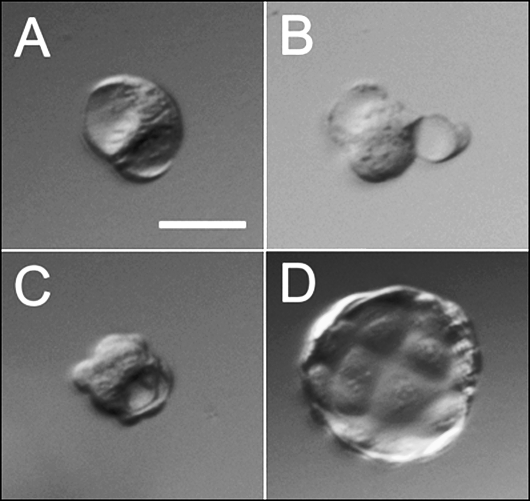
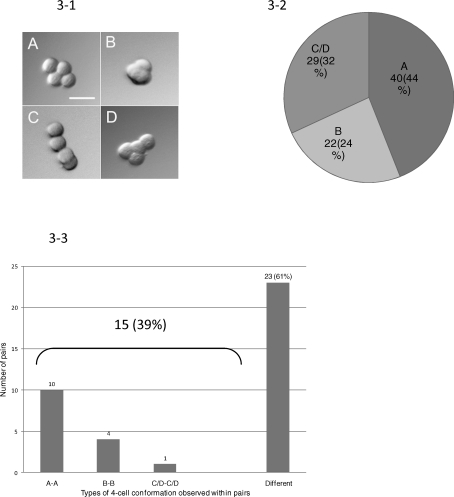
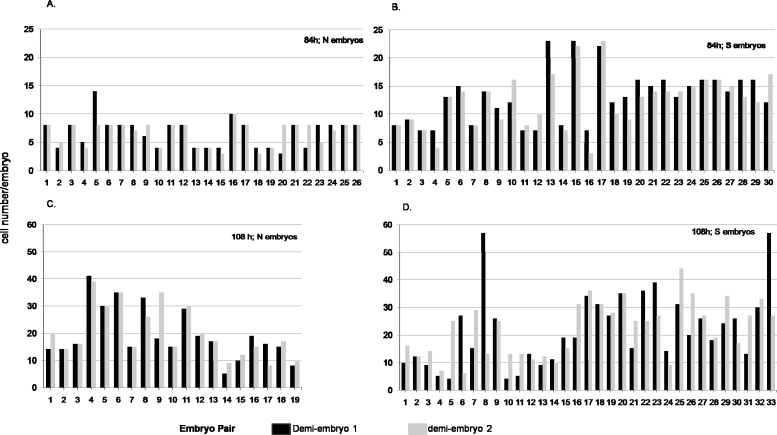
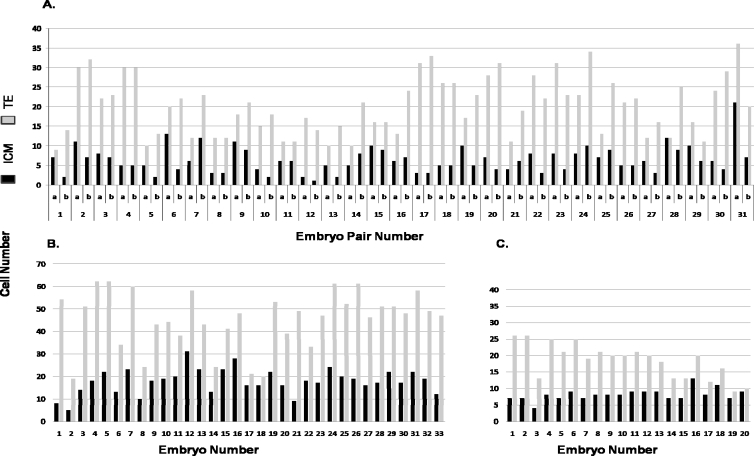
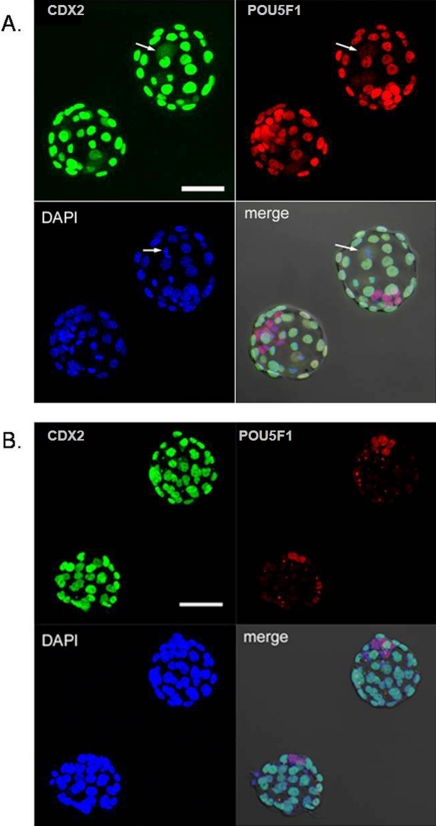
The development of blastomeres separated from two-cell stage murine embryos has been compared. Blastomeres were removed from the zona pellucida (ZP) and cultured individually; the twin embryos were compared during their progression to blastocyst in terms of development rate, cell number, morphology, conformation at the four-cell stage, and CDX2 and POU5F1 (also known as OCT4) expression. In general, twin embryos, whether obtained from superovulated or normally bred dams, displayed comparable cell numbers as they advanced. They formed morulae and blastocysts more or less synchronously with each other and with control embryos, although possessing about half of the latter's cell number. Despite this apparent synchrony, the majority of twin blastocysts differed in terms of their relative complements of POU5F1+/CDX2- cells, which represent inner cell mass (ICM), and POU5F1+/CDX2+ cells, which identify trophectoderm (TE). Many, but not all, exhibited a disproportionately small ICM. By contrast, demiembryos retained within their ZP and created by randomly damaging one of the two blastomeres in two-cell stage embryos exhibited a more normal ratio of ICM to TE cells at blastocyst and significantly less variance in ICM cell number. One possible explanation is that ZP-free demiembryos only infrequently adopt the same conformation as their partners, including the favorable tetrahedral form, at the four-cell stage, suggesting that such embryos exhibit a high degree of plasticity with regard to the orientation of their first two cleavage planes and that a significant number likely deviate from paths that provide an optimal geometric progression to blastocyst. These data could explain the difficulty of creating monozygotic twins from two-cell stage embryos.
Figures
Similar articles
-
The effect of superovulation on the contributions of individual blastomeres from 2-cell stage CF1 mouse embryos to the blastocyst.Int J Dev Biol. 2010;54(4):675-81. doi: 10.1387/ijdb.092942mk. Int J Dev Biol. 2010. PMID: 20209440 Free PMC article.
-
Developmental clock compromises human twin model created by embryo splitting.Hum Reprod. 2015 Dec;30(12):2774-84. doi: 10.1093/humrep/dev252. Epub 2015 Oct 21. Hum Reprod. 2015. PMID: 26489438
-
Production of monozygotic twin calves using the blastomere separation technique and Well of the Well culture system.Theriogenology. 2008 Mar 15;69(5):574-82. doi: 10.1016/j.theriogenology.2007.11.003. Epub 2008 Feb 1. Theriogenology. 2008. PMID: 18242681
-
Cdx2 is required for correct cell fate specification and differentiation of trophectoderm in the mouse blastocyst.Development. 2005 May;132(9):2093-102. doi: 10.1242/dev.01801. Epub 2005 Mar 23. Development. 2005. PMID: 15788452
-
Mechanism of Blastocyst Formation of the Mouse Embryo: (mouse embryo/blastocyst formation/ polarization/cell interaction/t12 mutation/tunicamycin).Dev Growth Differ. 1989 Dec;31(6):523-529. doi: 10.1111/j.1440-169X.1989.00523.x. Dev Growth Differ. 1989. PMID: 37281229 Review.
Cited by
-
Transcript profiling of individual twin blastomeres derived by splitting two-cell stage murine embryos.Biol Reprod. 2011 Mar;84(3):487-94. doi: 10.1095/biolreprod.110.086884. Epub 2010 Nov 10. Biol Reprod. 2011. PMID: 21076082 Free PMC article.
-
Totipotency: what it is and what it is not.Stem Cells Dev. 2014 Apr 15;23(8):796-812. doi: 10.1089/scd.2013.0364. Epub 2014 Feb 12. Stem Cells Dev. 2014. PMID: 24368070 Free PMC article.
-
Agarose capsules as new tools for protecting denuded mouse oocytes/embryos during handling and freezing-thawing and supporting embryonic development in vivo.Sci Rep. 2017 Dec 20;7(1):17960. doi: 10.1038/s41598-017-18365-z. Sci Rep. 2017. PMID: 29263435 Free PMC article.
-
Developmental capacity is unevenly distributed among single blastomeres of 2-cell and 4-cell stage mouse embryos.Sci Rep. 2021 Nov 2;11(1):21422. doi: 10.1038/s41598-021-00834-1. Sci Rep. 2021. PMID: 34728646 Free PMC article.
-
Totipotency segregates between the sister blastomeres of two-cell stage mouse embryos.Sci Rep. 2017 Aug 15;7(1):8299. doi: 10.1038/s41598-017-08266-6. Sci Rep. 2017. PMID: 28811525 Free PMC article.
References
-
- Haque FN, Gottesman II, Wong AH.Not really identical: epigenetic differences in monozygotic twins and implications for twin studies in psychiatry. Am J Med Genet C Semin Med Genet 2009; 151C: 136–141. - PubMed
-
- Whitelaw NC, Whitelaw E.How lifetimes shape epigenotype within and across generations. Hum Mol Genet 2006; 15(spec. no. 2):R131–R137. - PubMed
-
- Kaminsky ZA, Tang T, Wang SC, Ptak C, Oh GH, Wong AH, Feldcamp LA, Virtanen C, Halfvarson J, Tysk C, McRae AF, Visscher PM, et al. DNA methylation profiles in monozygotic and dizygotic twins. Nat Genet 2009; 41: 240–245. - PubMed
Publication types
MeSH terms
Substances
Grants and funding
LinkOut - more resources
Full Text Sources
Other Literature Sources
