. 2010 May;84(9):4426-41.
doi: 10.1128/JVI.02393-09. Epub 2010 Feb 24.

Catching a virus in the act of RNA release: a novel poliovirus uncoating intermediate characterized by cryo-electron microscopy

Affiliations

Catching a virus in the act of RNA release: a novel poliovirus uncoating intermediate characterized by cryo-electron microscopy

Hazel C Levy et al. J Virol. 2010 May.

Abstract

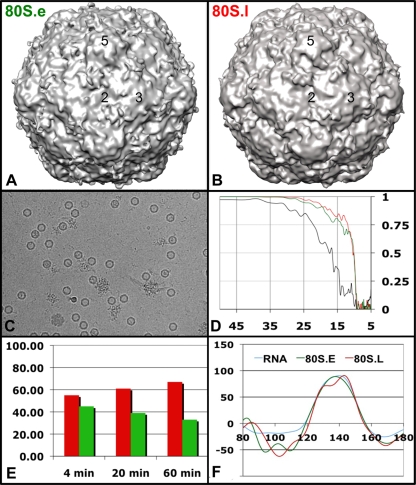
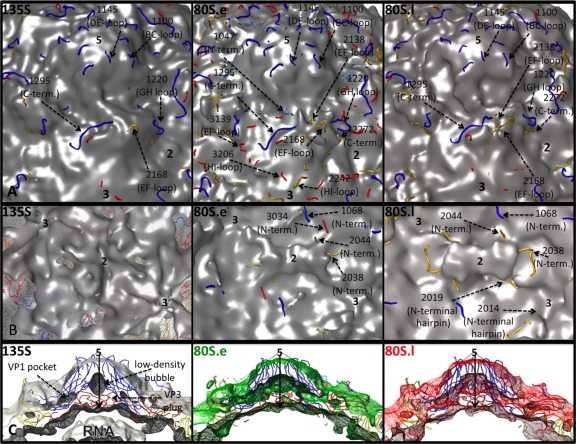
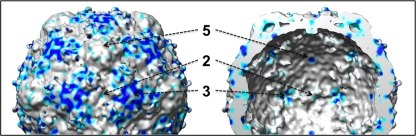
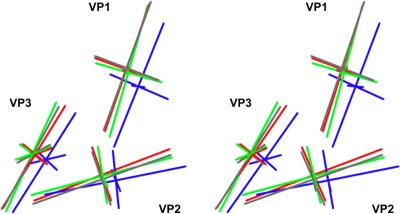
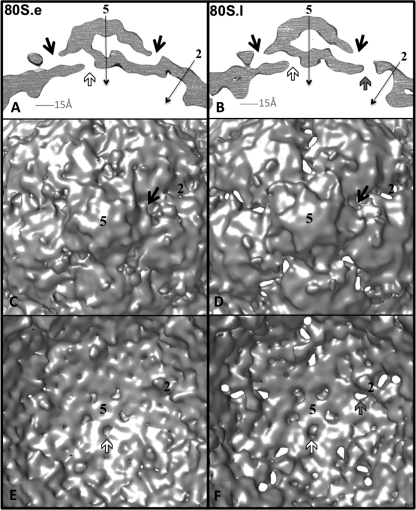
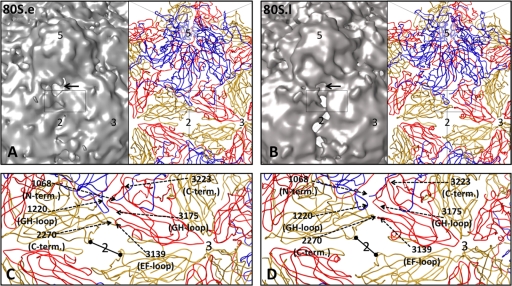
Poliovirus infection requires that the particle undergo a series of conformational transitions that lead to cell entry and genome release. In an effort to understand the conformational changes associated with the release of the RNA genome, we have used cryo-electron microscopy to characterize the structure of the 80S "empty" particles of poliovirus that are thought to represent the final product of the cell entry pathway. Using two-dimensional classification methods, we show that preparations of 80S particles contain at least two structures, which might represent snapshots from a continuous series of conformers. Using three-dimensional reconstruction methods, we have solved the structure of two distinct forms at subnanometric resolution, and we have built and refined pseudoatomic models into the reconstructions. The reconstructions and the derived models demonstrate that the two structural forms are both slightly expanded, resulting in partial disruption of interprotomer interfaces near their particle 2-fold axes, which may represent the site where RNA is released. The models demonstrate that each of the two 80S structures has undergone a unique set of movements of the capsid proteins, associated with rearrangement of flexible loops and amino-terminal extensions that participate in contacts between protomers, between pentamers, and with the viral RNA.


Figures

FIG. 1.
FIG. 1.
Structural features of poliovirus. (A, left) Radial-depth-cued (regions closer to the particle center are darker) space-filling model of the native virus particle (accession number 1HSX [23]); (right) a ribbon representation of one protomer, shown enlarged over a portion of an icosahedral framework. VP1 is blue, VP2 is yellow, VP3 is red, and myrVP4 is green. The axes of icosahedral symmetry are labeled using the numbers 2, 3, and 5. (B) Geometric representation of the core structure shared by the major capsid proteins (VP1, VP2, and VP3). The major coat proteins are structurally similar to one another; each has a central core consisting of two β-sheets arranged in an eight-stranded, wedge-shaped β-barrel motif. Individual β-strands are labeled using the letters B through I (in an amino-to-carboxyl direction) resulting in two sheets named BIDG (front) and CHEF (back) for the participating strands. Connecting loops are denoted by two letters (e.g., the GH loop connects β-strands G and H). Structurally conserved α-helices are represented by cylinders. The narrow ends of 5-fold-symmetry-related VP1 proteins are clustered together around each 5-fold axis of symmetry, while the narrow ends of the VP2 and VP3 β-barrels alternate around the 3-fold axes (28). (C) Internal network formed by the minor coat protein myrVP4 and by the amino-terminal extensions of the major coat proteins. (D) A twisted β-tube serves as a “plug” by separating a low-density region below the 5-fold VP1 mesa (blue) from the space interior to the capsid. This intrapentameric structure is made from 5-fold-symmetry-related copies of the extreme amino-terminal peptides from VP3 (red), myrVP4 (green), and VP1 (blue). The amino terminus of myrVP4 is covalently linked to a myristic acid moiety (magenta), which mediates the interactions of myrVP4 with the VP3 plug. During viral assembly, formation of this structure stabilizes the assembly of protomers into pentamers. (E) A seven-stranded β-sheet with contributions from two different pentamers. The uppermost four strands are contributed by the CHEF sheet from VP3 (red) and the lowermost, seventh strand is contributed by VP1 (blue) from the same protomer. Strands 4 and 7 thus form a clamp around strands 5 and 6, which are contributed by a β-hairpin from the amino-terminal extension of VP2 (yellow) from a neighboring pentamer. Formation of this extended sheet stabilizes the association of pentamers to form a closed icosahedral shell. Dashed lines represent electrostatic interactions. VP2 residues (Y2041 and W2038, shown as yellow ball-and-stick models), which flank the β-hairpin, appear to interact with encapsidated RNA and with the extreme carboxyl terminus of myrVP4. VP2 residues S2010 and D2011 interact with myrVP4 residues (shown as green ball-and-stick structures) N4069 and M4067, respectively, tethering the products of myrVP0 cleavage together.
FIG. 2.
FIG. 2.
Cryo-EM reconstructions of poliovirus 80S empty capsids (early and late RNA-releasing forms) to ∼9.5 Å resolution. 3D reconstructions of the early form, 80S.e (A), and the late form, 80S.l (B), are shown as isocontour surfaces, showing the outer surface of the capsid, each contoured at 1.5σ and viewed along a 2-fold axis of symmetry. To recapitulate the RNA release process, purified samples of mature (160S) poliovirions were heated to 56°C. (C) Electron micrograph of vitrified, heat-treated poliovirus particles at various stages of RNA release imaged at ×59,000 magnification and ∼7 μm underfocus. (D) Fourier shell correlation plots for 80S reconstructions calculated using the entire data set (black line) or using only those images classified as early (green) or late (red) in the RNA release process. Vertical axis: FSC; horizontal axis: resolution in angstroms. Classification improved the resolution of the reconstructions from about 16 Å to 9.5 Å, indicating that the differences are real. (E) The proportion of 80S particles that partition into the early (green) and late (red) classifications varies, depending on the length of the heat treatment time. (F) Radially averaged density plots were determined from three groups of 2D images: green, particles from the early class; red, particles from the late class; blue, particles that appeared to be attached to expelled RNA. The radial location of the inner and outer protein-solvent boundaries (∼125 to 155 Å) does not appear to differ significantly between the three groups, suggesting that the particles are not expanded to different extents overall.
FIG. 3.
FIG. 3.
Close-up views of the inner and outer isocontour surfaces of the 135S and 80S capsids, and the fit of pseudoatomic models, after refinement. (A and B) Views of the outer surface (A) and inner surface (B) of the capsid, shown at contour levels of 1σ, 1.5σ, and 1.5σ, respectively, for the 135S (left), 80S.e (middle), and 80S.l (right) maps (a different contour level is used for the 135S density map because it contains density for the RNA genome and is compared to 80S at similar capsid protein volumes). Refined coordinates for pseudoatomic models of the poliovirus capsid proteins VP1 (blue), VP2 (yellow), and VP3 (red) are shown as main chain traces. Polypeptides that lie outside the chosen contours and representative residue numbers within them are labeled and indicated by dashed arrows. Symmetry axes are labeled with the numbers 2, 3, and 5. The chosen contour level is low enough that the protein shell appears to be closed, with none of the holes extending completely through the capsid, but high enough that unattached noise density is not visible. (C) 30-Å-thick, central slice of the cryo-EM density maps, 135S (gray, left), 80S.e (green, middle), and 80S.l (red, right), showing the enclosed pseudoatomic models docked into them, using density contour levels of 1.5σ, 3σ, and 3σ, respectively. In the 135S map, black arrows indicate the 5-fold axis, and labels indicate the VP3 plug and low-density bubble lying along that axis, the VP1 lipid-binding pocket, and RNA density on the interior.
FIG. 4.
FIG. 4.
Density maps made from atomic models of the native-antigenic empty capsid assembly intermediate (73S) and the mature, native capsid (160S). These two structures are nearly identical on their exterior surfaces but differ dramatically at the interior surface. The transition from 73S to 160S is marked by cleavage of the precursor protein myrVP0 into myrVP4 and VP2 and by encapsidation of viral RNA. The density maps (shown superimposed on an icosahedral framework) were generated by filtering the atomic models from crystal structures (73S from PDB entry 1POV [4]; 160S from PDB entry1HSX [23]) to 10 Å resolution and applying a temperature factor of 300. (A) Outer surface of 160S. (B) Central sections from the density maps are shown in gray mesh, with 73S on the left and 160S on the right, superimposed on a ribbon representation of the 160S atomic model. Certain interior features and the 5-fold-symmetry axes are labeled. (C) The inner surface of the capsid, viewed along the 2-fold-symmetry axis, in 73S (left) and 160S (right). To provide landmarks, ribbon representations of the 160S atomic model are provided, with VP1 in blue, VP2 in yellow, VP3 in red, and myrVP4 in green. Symmetry axes are labeled 2, 3, and 5. On its inner surface, 73S (left) displays an oblong depression at each 2-fold axis and a deep trefoil depression at each 3-fold axis. In 160S (right), these depressions have been filled in by ordered polypeptides: the trefoil depression is filled by the products of myrVP0 cleavage (the carboxyl terminus of myrVP4 and amino terminus of VP2), together with 1028 to 1054 of VP1, and 3160 to 3161 of VP3; the 2-fold depression is filled by polypeptides 1048 to 1067 and 2045 to 2056. Several of these dynamic peptides become rearranged further during cell entry.
FIG. 5.
FIG. 5.
Variance maps, calculated from the population of heat-treated particles. An isocontour surface, showing a portion of the 80S.e reconstruction, has been colored to reflect the degree of voxel-wise variability seen in the heat-treated data set as a whole. The outer surface of the capsid is shown on the left and the inner surface on the right, and the symmetry axes are labeled 2, 3, and 5. Regions colored in gray have the lowest variance (<1σ), those colored in cyan have a higher variance (1 to 2σ), and those colored in dark blue have the highest variance (2 to 3σ).
FIG. 6.
FIG. 6.
How the position and orientation of the major capsid proteins differ in the refined pseudoatomic models. Each capsid protein is represented by the major and minor axes of its ellipsoid of rotation, and displayed as a stereo pair. The axes for 160S (blue), 135S (gray), 80S.e (green), and 80S.l (red) are overlaid to illustrate relative positions and tilts. Axes for VP1, VP2, and VP3 are labeled.
FIG. 7.
FIG. 7.
Holes in the 80S density maps may serve as routes of egress through the capsid. Cryo-EM density maps for 80S.e (A, C, and E) and 80S.l (B, D, and F) are contoured at 3σ to visualize regions of lowest density. (A and B) 5-Å-thick central slices of maps show the locations of low-density pores through the capsid shell. In each structure, openings at the interior surface (white arrows), near the 5-fold plug, are connected, via the low-density bubble along the 5-fold axis, to the lipid-binding pocket of VP1, which connects to the outer surface via a pore (black arrows) that is located near the quasi-3-fold axis. Thus, a twisted, continuous channel through the shell is formed. 80S.l has an additional more direct path through the shell (gray arrow). Symmetry axes are labeled with thin black arrows. (C and D) 80S.e (C) and 80S.l (D). The outer surface of each map is viewed along a 5-fold axis of symmetry. At the present contour level, the direct holes in the 80S.l map are evident. At a higher contour level, holes in the 80S.e map appear in similar positions (not shown). (E and F) 80S.e (E) and 80S.l (F). Shown are close-up views of a portion of the inner surface. All arrow colors and axis labels correspond to those in panels A and B.
FIG. 8.
FIG. 8.
Pseudoatomic models reveal peptides that may rearrange for RNA egress. Density maps (contoured at 3σ) for 80S.e (A) and 80S.l (B) are shown on the left, side by side with their respective pseudoatomic models (right), to reveal low-density regions between protomers. Some of the symmetry axes are labeled 2, 3, and 5. The region indicated by the black rectangle includes residues previously implicated by mutagenesis to have an effect on assembly, receptor binding, capsid stability and structural transitions (see text). (C and D) Close-up views of a portion of the pseudoatomic models boxed in panels A and B, respectively. Representative residues, labeled using dashed arrows, lie in the interface between 5-fold-symmetry-related protomers. Black bars with dots mark the shortest dimension across the hole at the 2-fold axis, which is 15.3 Å in 80S.e and 15.0 Å in 80S.l. The longer dimension of the hole is 27.3 Å for 80S.e and 31.6 Å for 80S.l.
FIG. 9.
FIG. 9.
Mutations that influence assembly, receptor binding, and uncoating are clustered in the interface between 5-fold-symmetry-related protomers. Main chain traces of a portion of VP1 (blue), VP2 (yellow), and VP3 (red) are shown in stereo (left). The locations of specific residues are shown as spheres (left) and labeled (right). Residues from VP1 and VP2 on the left side of the interface come from one protomer. On the right side of the interface, residues from VP3 belong to a second (5-fold-symmetry-related) protomer, and residues from VP2 belong to a third (3-fold-symmetry-related) protomer. When mutated, the indicated residues influence assembly (2018, 2215, 3091, 3108, 3175, 3178, and 3223) (1, 19, 38, 39), receptor binding (1226, 1228, 1231, 1241, 2215, and 3178) (13), and the ability of particles to transition from 160S to 135S (1095, 1160, 1226, 1228, 1231, 1241, 2215, and 3178) (13, 51). Residues 2215 and 3178 fall into all three categories.

Similar articles

Cited by

References

    1. Ansardi, D. C., M. Luo, and C. D. Morrow. 1994. Mutations in the poliovirus P1 capsid precursor at arginine residues VP4-ARG34, VP3-ARG223, and VP1-ARG129 affect virus assembly and encapsidation of genomic RNA. Virology 199:20-34. - PubMed
    1. Arnold, E., and M. G. Rossmann. 1990. Analysis of the structure of a common cold virus, human rhinovirus 14, refined at a resolution of 3.0 Å. J. Mol. Biol. 211:763-801. - PubMed
    1. Baker, T. S., and R. H. Cheng. 1996. A model-based approach for determining orientations of biological macromolecules imaged by cryoelectron microscopy. J. Struct. Biol. 116:120-130. - PubMed
    1. Basavappa, R., R. Syed, O. Flore, J. P. Icenogle, D. J. Filman, and J. M. Hogle. 1994. Role and mechanism of the maturation cleavage of VP0 in poliovirus assembly: structure of the empty capsid assembly intermediate at 2.9 Å resolution. Protein Sci. 3:1651-1669. - PMC - PubMed
    1. Belnap, D. M., D. J. Filman, B. L. Trus, N. Cheng, F. P. Booy, J. F. Conway, S. Curry, C. N. Hiremath, S. K. Tsang, A. C. Steven, and J. M. Hogle. 2000. Molecular tectonic model of virus structural transitions: the putative cell entry states of poliovirus. J. Virol. 74:1342-1354. - PMC - PubMed

Publication types

LinkOut - more resources