. 2010 May;84(9):4556-68.
doi: 10.1128/JVI.02545-09. Epub 2010 Feb 24.

T cells facilitate recovery from Venezuelan equine encephalitis virus-induced encephalomyelitis in the absence of antibody

Affiliations

T cells facilitate recovery from Venezuelan equine encephalitis virus-induced encephalomyelitis in the absence of antibody

Christopher B Brooke et al. J Virol. 2010 May.

Abstract

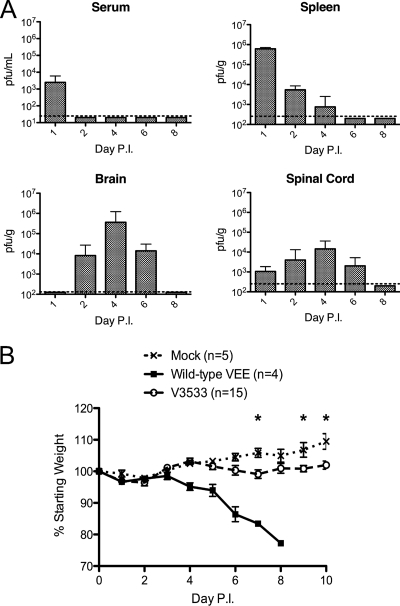
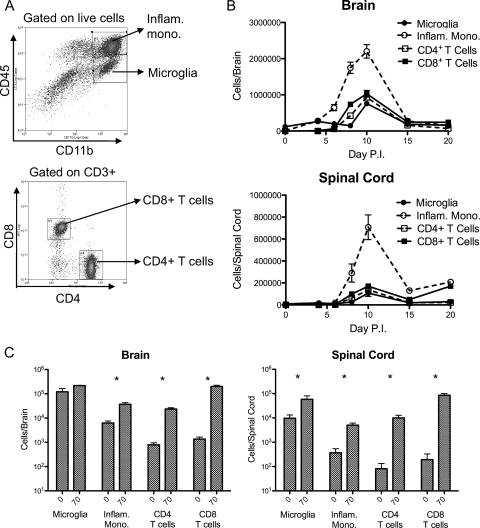
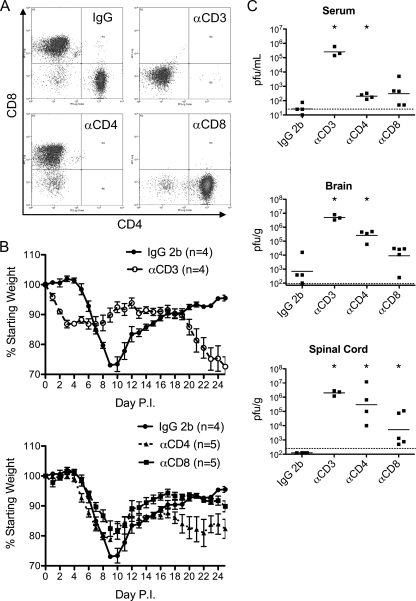
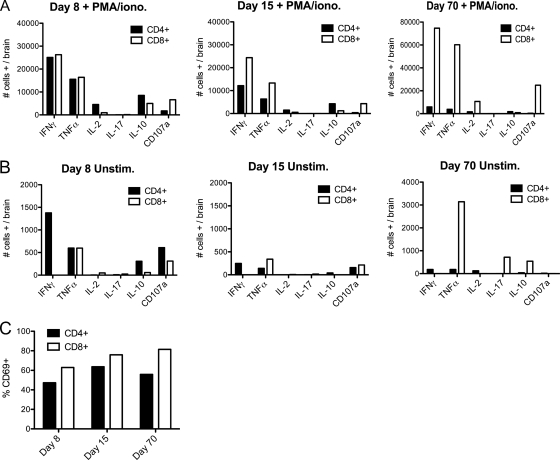
Venezuelan equine encephalitis virus (VEEV) is a mosquito-borne RNA virus of the genus Alphavirus that is responsible for a significant disease burden in Central and South America through sporadic outbreaks into human and equid populations. For humans, 2 to 4% of cases are associated with encephalitis, and there is an overall case mortality rate of approximately 1%. In mice, replication of the virus within neurons of the central nervous system (CNS) leads to paralyzing, invariably lethal encephalomyelitis. However, mice infected with certain attenuated mutants of the virus are able to control the infection within the CNS and recover. To better define what role T cell responses might be playing in this process, we infected B cell-deficient microMT mice with a VEEV mutant that induces mild, sublethal illness in immune competent mice. Infected microMT mice rapidly developed the clinical signs of severe paralyzing encephalomyelitis but were eventually able to control the infection and recover fully from clinical illness. Recovery in this system was T cell dependent and associated with a dramatic reduction in viral titers within the CNS, followed by viral persistence in the brain. Further comparison of the relative roles of T cell subpopulations within this system revealed that CD4(+) T cells were better producers of gamma interferon (IFN-gamma) than CD8(+) T cells and were more effective at controlling VEEV within the CNS. Overall, these results suggest that T cells, especially CD4(+) T cells, can successfully control VEEV infection within the CNS and facilitate recovery from a severe viral encephalomyelitis.


Figures

FIG. 1.
FIG. 1.
V3533 induces mild, transient disease followed by clearance in C57BL/6 mice. (A) Female C57BL/6 mice (7 to 10 weeks old) were inoculated with 106 PFU of V3533 by injection in the left rear footpad. At the indicated days postinfection (Day P.I.), serum, spleen, brain, and spinal cord samples were collected from V3533-infected mice and homogenized. The amount of infectious virus present in serum, spleen, brain, and spinal cord samples was then quantified by plaque assays of BHK-21 cells. Data are presented as the means ± standard deviations of results pooled from two independent experiments with 3 to 10 animals per time point. Dotted lines represent the limit of detection. (B) Female C57BL/6 mice (7 to 10 weeks old) were inoculated with 103 PFU of wild-type VEEV (V3000) or 106 PFU of V3533 by injection in the left rear footpad. Mock-infected mice were infected with diluent alone. Mice were weighed daily, with those losing more than 20% of their starting weight being euthanized as required by UNC IACUC regulations. *, P < 0.05 by Mann-Whitney testing.
FIG. 2.
FIG. 2.
Rag1−/− mice succumb to V3533 infection, whereas μMT mice recover. Female μMT or Rag1−/− mice (7 to 10 weeks old) were inoculated with 103 PFU of V3533 by injection in the left rear footpad. C57BL/6 mice received 106 PFU of V3533. (A) Mice were weighed daily, with those losing more than 35% of their starting weight being euthanized as required by UNC IACUC regulations. (B) Mice were scored for the development of encephalomyelitis based on the following scale: 1, hunched posture; 2, ruffled fur; 3, ataxia, imbalance; 4, conjunctivitis; 5, hind limb paresis, paralysis; 6, moribundity. Each data point represents the mean ± standard error of the mean (SEM) of the results obtained with 6 animals per group from a single representative experiment.
FIG. 3.
FIG. 3.
Recovery in μMT mice is associated with control of viral replication in the brain and clearance in the spinal cord. Female μMT or Rag1−/− mice (7 to 10 weeks old) were inoculated with 103 PFU of V3533 by injection in the left rear footpad. (A) At the time points indicated, serum, spleen, brain, and spinal cord samples were collected from infected μMT mice and homogenized. The amount of infectious virus present in the serum, spleen, brain, and spinal cord samples was then quantified by plaque assays of BHK-21 cells. Data points represent individual tissue titers pooled from two independent experiments. (B) Tissue titers from infected μMT mice at day 105 postinfection. (C) Comparison of tissue titers between μMT and Rag1−/− mice. Data are presented as the means ± SEM of titer values from 3 to 4 animals per group. In all cases, dotted lines represent the limit of detection.
FIG. 4.
FIG. 4.
Reduction of viral titers in the CNS coincides with an influx of T cells and inflammatory monocytes. Female μMT mice (7 to 10 weeks old) were inoculated with 103 PFU of V3533 or diluent alone by injection in the left rear footpad. At various time points postinfection, mice were perfused with PBS and CNS-infiltrating leukocytes were isolated. Infiltrating cells were stained for various surface markers and analyzed by flow cytometry. (A) Representative dot plots illustrating the gating scheme used to define cell populations. (B) Total numbers of microglia (CD11b+/CD45lo), inflammatory monocytes (CD11b+/CD45hi), CD4+ T cells (CD3+/CD4+), and CD8+ T cells (CD3+/CD8+) isolated from brain and spinal cord samples. For each time point, data are presented as the means ± the standard errors of the results obtained with 3 to 4 mice and are representative of 2 independent experiments. (C) Comparison of total cell numbers of indicated infiltrating leukocyte populations between mock-infected mice (left bar) and V3533-infected mice (right bar) 70 days postinfection. Data are presented as means ± standard errors of the results obtained with four animals per group. *, P < 0.05 by Mann-Whitney testing.
FIG. 5.
FIG. 5.
T cells are required for control of infection and recovery in μMT mice. Female μMT mice (7 to 10 weeks old) were treated with depleting antibodies against CD3, CD4, or CD8 or with an isotype control antibody and then inoculated with 103 PFU of V3533 by injection in the left rear footpad. Depletion treatments were continued for 25 days postinfection, at which point the experiment was terminated. (A) Representative dot plots of CD3+ splenocytes from each group, taken at day 25 postinfection. (B) Effect of T cell depletions on weight loss following V3533 infection. Data represent means ± standard errors of the results obtained with 4 to 5 animals per group. (C) Infectious virus from tissues harvested 25 days postinfection, assessed by plaque assays on BHK-21 cells. Each data point represents a single animal, with bars indicating the geometric means. *, P < 0.05 compared to control by Mann Whitney testing.
FIG. 6.
FIG. 6.
CD4+ T cells are the main producers of T-cell-associated IFN-γ within the brains of V3533-infected μMT mice. Female μMT mice (7 to 10 weeks old) were inoculated with 103 PFU of V3533 by injection in the left rear footpad. At the times indicated, mice were perfused with PBS and brain-infiltrating leukocytes were isolated. (A and B) Harvested cells were then pooled and either cultured in the presence of PMA-ionomycin for 6 h with brefeldin A with or without monensin added for the final 4 h (A) or cultured in the presence of brefeldin A with or without monensin with no additional stimulus for 4 h (B). Following treatment, cells were surface stained for CD3α, CD4, and CD8 and then stained for the intracellular presence of multiple cytokines. Each bar represents the number of cells of a given cell type that stained as positive for the indicated cytokine-surface marker per brain (days 8 and 15) or the percentage of pooled cells that stained as positive (day 70). (C) Percentages of T cells positive for CD69 surface expression in the absence of ex vivo stimulation. Data shown were generated in a single experiment but are representative of 2 to 3 independent experiments.

Similar articles

Cited by

References

    1. Aronson, J. F., F. B. Grieder, N. L. Davis, P. C. Charles, T. Knott, K. Brown, and R. E. Johnston. 2000. A single-site mutant and revertants arising in vivo define early steps in the pathogenesis of Venezuelan equine encephalitis virus. Virology 270:111-123. - PubMed
    1. Bergmann, C. C., C. Ramakrishna, M. Kornacki, and S. A. Stohlman. 2001. Impaired T cell immunity in B cell-deficient mice following viral central nervous system infection. J. Immunol. 167:1575-1583. - PubMed
    1. Bernard, K. A., W. B. Klimstra, and R. E. Johnston. 2000. Mutations in the E2 glycoprotein of Venezuelan equine encephalitis virus confer heparan sulfate interaction, low morbidity, and rapid clearance from blood of mice. Virology 276:93-103. - PubMed
    1. Bilzer, T., and L. Stitz. 1994. Immune-mediated brain atrophy. CD8+ T cells contribute to tissue destruction during borna disease. J. Immunol. 153:818-823. - PubMed
    1. Binder, G. K., and D. E. Griffin. 2001. Interferon-gamma-mediated site-specific clearance of alphavirus from CNS neurons. Science 293:303-306. - PubMed

Publication types