

Selective regions of the visuomotor system are related to gain-induced changes in force error
- PMID: 20181732
- PMCID: PMC2853269
- DOI: 10.1152/jn.00920.2009
Selective regions of the visuomotor system are related to gain-induced changes in force error
Abstract
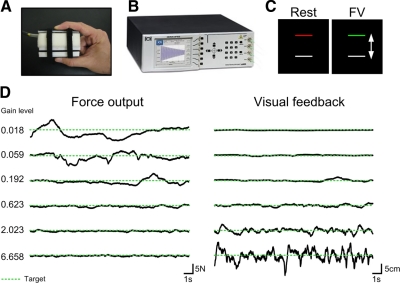
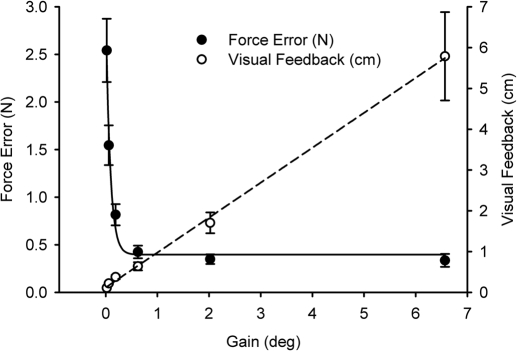
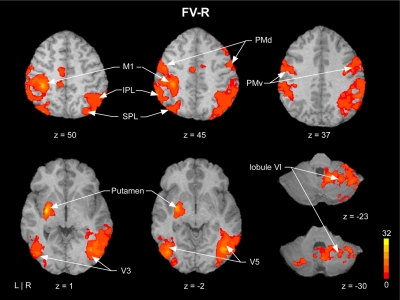
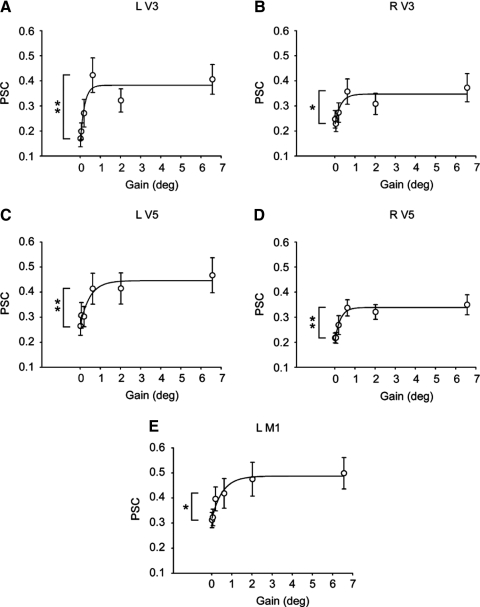
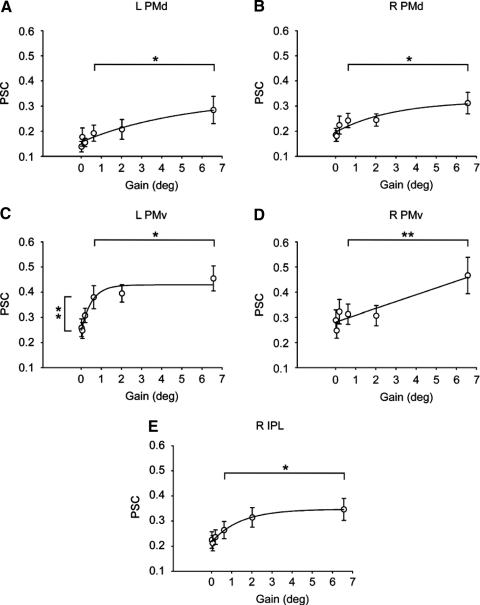
When humans perform movements and receive on-line visual feedback about their performance, the spatial qualities of the visual information alter performance. The spatial qualities of visual information can be altered via the manipulation of visual gain and changes in visual gain lead to changes in force error. The current study used functional magnetic resonance imaging during a steady-state precision grip force task to examine how cortical and subcortical brain activity can change with visual gain induced changes in force error. Small increases in visual gain < 1° were associated with a substantial reduction in force error and a small increase in the spatial amplitude of visual feedback. These behavioral effects corresponded with an increase in activation bilaterally in V3 and V5 and in left primary motor cortex and left ventral premotor cortex. Large increases in visual gain > 1° were associated with a small change in force error and a large change in the spatial amplitude of visual feedback. These behavioral effects corresponded with increased activity bilaterally in dorsal and ventral premotor areas and right inferior parietal lobule. Finally, activity in the left and right lobule VI of the cerebellum and left and right putamen did not change with increases in visual gain. Together, these findings demonstrate that the visuomotor system does not respond uniformly to changes in the gain of visual feedback. Instead, specific regions of the visuomotor system selectively change in activity related to large changes in force error and large changes in the spatial amplitude of visual feedback.
Figures
Similar articles
-
Intermittent visuomotor processing in the human cerebellum, parietal cortex, and premotor cortex.J Neurophysiol. 2006 Feb;95(2):922-31. doi: 10.1152/jn.00718.2005. Epub 2005 Nov 2. J Neurophysiol. 2006. PMID: 16267114 Free PMC article. Clinical Trial.
-
Visual feedback alters force control and functional activity in the visuomotor network after stroke.Neuroimage Clin. 2017 Nov 14;17:505-517. doi: 10.1016/j.nicl.2017.11.012. eCollection 2018. Neuroimage Clin. 2017. PMID: 29201639 Free PMC article. Clinical Trial.
-
Modulation of ventral premotor and primary motor cortex interactions for accurate visuomotor force control.Cortex. 2025 May;186:51-60. doi: 10.1016/j.cortex.2025.03.005. Epub 2025 Mar 21. Cortex. 2025. PMID: 40156993
-
How do visual instructions influence the motor system?Novartis Found Symp. 1998;218:129-41; discussion 141-6. doi: 10.1002/9780470515563.ch8. Novartis Found Symp. 1998. PMID: 9949819 Review.
-
Motor functions of the parietal lobe.Curr Opin Neurobiol. 2005 Dec;15(6):626-31. doi: 10.1016/j.conb.2005.10.015. Epub 2005 Nov 3. Curr Opin Neurobiol. 2005. PMID: 16271458 Review.
Cited by
-
The effect of force feedback delay on stiffness perception and grip force modulation during tool-mediated interaction with elastic force fields.J Neurophysiol. 2015 May 1;113(9):3076-89. doi: 10.1152/jn.00229.2014. Epub 2015 Feb 25. J Neurophysiol. 2015. PMID: 25717155 Free PMC article.
-
Force control is related to low-frequency oscillations in force and surface EMG.PLoS One. 2014 Nov 5;9(11):e109202. doi: 10.1371/journal.pone.0109202. eCollection 2014. PLoS One. 2014. PMID: 25372038 Free PMC article.
-
Modulation of force below 1 Hz: age-associated differences and the effect of magnified visual feedback.PLoS One. 2013;8(2):e55970. doi: 10.1371/journal.pone.0055970. Epub 2013 Feb 11. PLoS One. 2013. PMID: 23409099 Free PMC article.
-
Unraveling somatotopic organization in the human brain using machine learning and adaptive supervoxel-based parcellations.Neuroimage. 2021 Dec 15;245:118710. doi: 10.1016/j.neuroimage.2021.118710. Epub 2021 Nov 12. Neuroimage. 2021. PMID: 34780917 Free PMC article.
-
Speed but not amplitude of visual feedback exacerbates force variability in older adults.Exp Brain Res. 2018 Oct;236(10):2563-2571. doi: 10.1007/s00221-018-5317-0. Epub 2018 Jun 23. Exp Brain Res. 2018. PMID: 29936533
References
-
- Caminiti R, Ferraina S, Johnson PB. The sources of visual information to the primate frontal lobe: a novel role for the superior parietal lobule. Cereb Cortex 6: 319–328, 1996 - PubMed
-
- Carey JR, Greer KR, Grunewald TK, Steele JL, Wiemiller JW, Bhatt E, Nagpal A, Lungu O, Auerbach EJ. Primary motor area activation during precision-demanding versus simple finger movement. Neurorehabil Neural Repair 20: 361–370, 2006 - PubMed
-
- Crowe DA, Chafee MV, Averbeck BB, Georgopoulos AP. Participation of primary motor cortical neurons in a distributed network during maze solution: representation of spatial parameters and time-course comparison with parietal area 7a. Exp Brain Res 158: 28–34, 2004 - PubMed
-
- Culham JC, Brandt SA, Cavanagh P, Kanwisher NG, Dale AM, Tootell RB. Cortical fMRI activation produced by attentive tracking of moving targets. J Neurophysiol 80: 2657–2670, 1998 - PubMed
Publication types
MeSH terms
Grants and funding
LinkOut - more resources
Full Text Sources