

Fine temporal structure of beta oscillations synchronization in subthalamic nucleus in Parkinson's disease
- PMID: 20181734
- PMCID: PMC2867579
- DOI: 10.1152/jn.00724.2009
Fine temporal structure of beta oscillations synchronization in subthalamic nucleus in Parkinson's disease
Abstract
Synchronous oscillatory dynamics in the beta frequency band is a characteristic feature of neuronal activity of basal ganglia in Parkinson's disease and is hypothesized to be related to the disease's hypokinetic symptoms. This study explores the temporal structure of this synchronization during episodes of oscillatory beta-band activity. Phase synchronization (phase locking) between extracellular units and local field potentials (LFPs) from the subthalamic nucleus (STN) of parkinsonian patients is analyzed here at a high temporal resolution. We use methods of nonlinear dynamics theory to construct first-return maps for the phases of oscillations and quantify their dynamics. Synchronous episodes are interrupted by less synchronous episodes in an irregular yet structured manner. We estimate probabilities for different kinds of these "desynchronization events." There is a dominance of relatively frequent yet very brief desynchronization events with the most likely desynchronization lasting for about one cycle of oscillations. The chances of longer desynchronization events decrease with their duration. The observed synchronization may primarily reflect the relationship between synaptic input to STN and somatic/axonal output from STN at rest. The intermittent, transient character of synchrony even on very short time scales may reflect the possibility for the basal ganglia to carry out some informational function even in the parkinsonian state. The dominance of short desynchronization events suggests that even though the synchronization in parkinsonian basal ganglia is fragile enough to be frequently destabilized, it has the ability to reestablish itself very quickly.
Figures
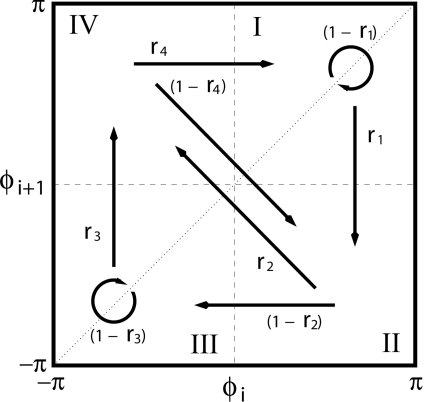
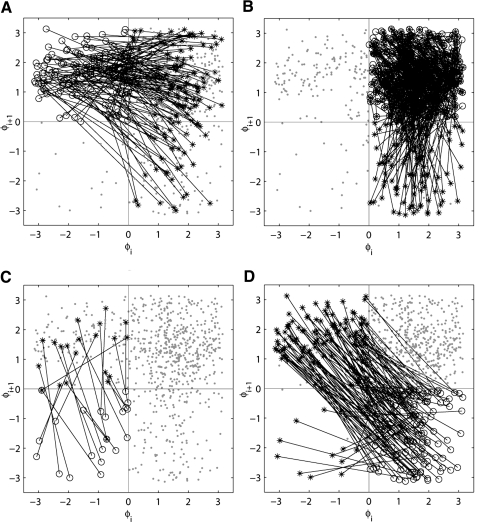
 . Lines connect each circle to a star—the point, to which this circle evolves. Thus each plot shows the transitions from a corresponding part of the phase space. Note the high density of the circles, stars, and lines in the B; this is due to the fact that this part of the phase space (1st region) contains the synchronized state.
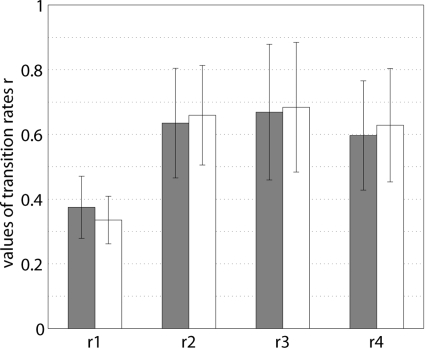
 and ◽, represent different lengths of the time window used to compute the synchronization index γ (1 s and 1.5, respectively) and thus represent the results of different inclusion criteria for the original data. Vertical lines indicate SD.
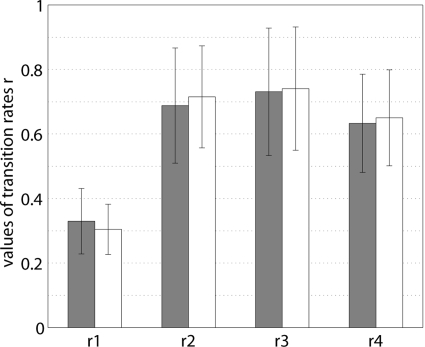 and ◽, different lengths of the time window used to compute the synchronization index γ (1 s and 1.5, respectively). Note the qualitative similarity with the Fig. 5.
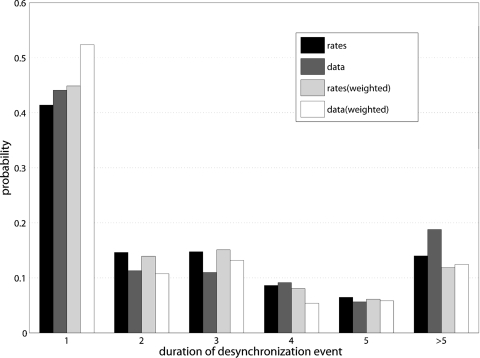
Similar articles
-
Interaction of synchronized dynamics in cortex and basal ganglia in Parkinson's disease.Eur J Neurosci. 2015 Sep;42(5):2164-71. doi: 10.1111/ejn.12980. Epub 2015 Jul 6. Eur J Neurosci. 2015. PMID: 26154341
-
Potential mechanisms for imperfect synchronization in parkinsonian basal ganglia.PLoS One. 2012;7(12):e51530. doi: 10.1371/journal.pone.0051530. Epub 2012 Dec 19. PLoS One. 2012. PMID: 23284707 Free PMC article.
-
Adaptive grip force is modulated by subthalamic beta activity in Parkinson's disease patients.Neuroimage Clin. 2015 Sep 29;9:450-7. doi: 10.1016/j.nicl.2015.09.010. eCollection 2015. Neuroimage Clin. 2015. PMID: 26594627 Free PMC article.
-
Dynamics of human subthalamic neuron phase-locking to motor and sensory cortical oscillations during movement.J Neurophysiol. 2017 Sep 1;118(3):1472-1487. doi: 10.1152/jn.00964.2016. Epub 2017 Jun 7. J Neurophysiol. 2017. PMID: 28592690 Free PMC article.
-
Electrocorticography reveals beta desynchronization in the basal ganglia-cortical loop during rest tremor in Parkinson's disease.Neurobiol Dis. 2016 Feb;86:177-86. doi: 10.1016/j.nbd.2015.11.023. Epub 2015 Nov 27. Neurobiol Dis. 2016. PMID: 26639855 Free PMC article.
Cited by
-
Burst synchronization in a scale-free neuronal network with inhibitory spike-timing-dependent plasticity.Cogn Neurodyn. 2019 Feb;13(1):53-73. doi: 10.1007/s11571-018-9505-1. Epub 2018 Sep 11. Cogn Neurodyn. 2019. PMID: 30728871 Free PMC article.
-
Neural dynamics in parkinsonian brain: the boundary between synchronized and nonsynchronized dynamics.Phys Rev E Stat Nonlin Soft Matter Phys. 2011 Apr;83(4 Pt 1):042901. doi: 10.1103/PhysRevE.83.042901. Epub 2011 Apr 13. Phys Rev E Stat Nonlin Soft Matter Phys. 2011. PMID: 21599224 Free PMC article.
-
Average beta burst duration profiles provide a signature of dynamical changes between the ON and OFF medication states in Parkinson's disease.PLoS Comput Biol. 2021 Jul 7;17(7):e1009116. doi: 10.1371/journal.pcbi.1009116. eCollection 2021 Jul. PLoS Comput Biol. 2021. PMID: 34233347 Free PMC article.
-
Spike-Timing Dependent Plasticity Effect on the Temporal Patterning of Neural Synchronization.Front Comput Neurosci. 2020 Jun 12;14:52. doi: 10.3389/fncom.2020.00052. eCollection 2020. Front Comput Neurosci. 2020. PMID: 32595464 Free PMC article.
-
Short desynchronization episodes prevail in synchronous dynamics of human brain rhythms.Chaos. 2013 Mar;23(1):013138. doi: 10.1063/1.4794793. Chaos. 2013. PMID: 23556975 Free PMC article.
References
-
- Baker SN, Kilner JM, Pinches EM, Lemon RN. The role of synchrony and oscillations in the motor output. Exp Brain Res 128: 109–117, 1999. - PubMed
-
- Bergman H, Feingold A, Nini A, Raz A, Slovin H, Abeles M, Vaadia E. Physiological aspects of information processing in the basal ganglia of normal and parkinsonian primates. Trends Neurosci 21: 32–38, 1998. - PubMed
-
- Berke JD, Okatan M, Skurski J, Eichenbaum HB. Oscillatory entrainment of striatal neurons in freely moving rats. Neuron 43: 883–896, 2004. - PubMed
Publication types
MeSH terms
Grants and funding
LinkOut - more resources
Full Text Sources
Other Literature Sources
Medical