. 2010 Apr;137(7):1075-84.
doi: 10.1242/dev.049437. Epub 2010 Feb 24.

Polycystin-dependent fluid flow sensing targets histone deacetylase 5 to prevent the development of renal cysts

Affiliations

Polycystin-dependent fluid flow sensing targets histone deacetylase 5 to prevent the development of renal cysts

Sheng Xia et al. Development. 2010 Apr.

Abstract

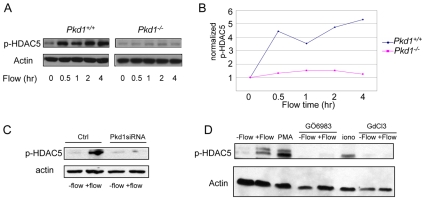
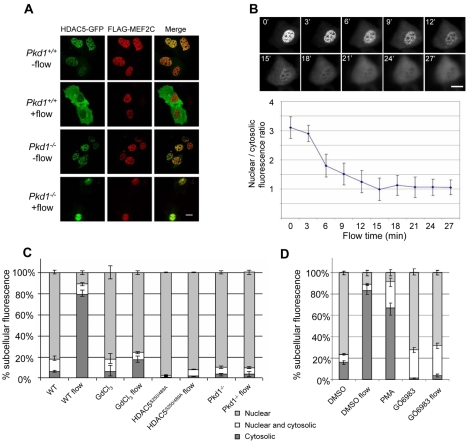
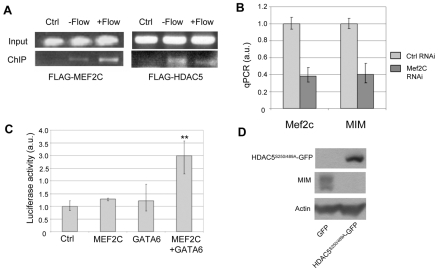
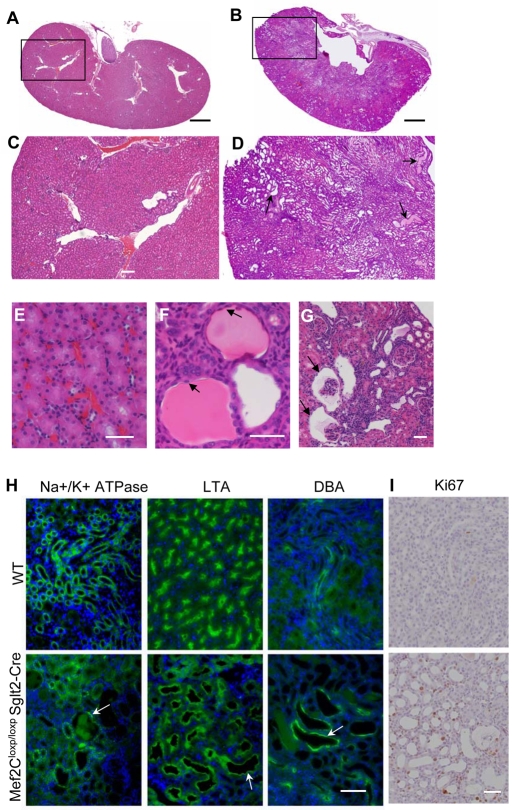
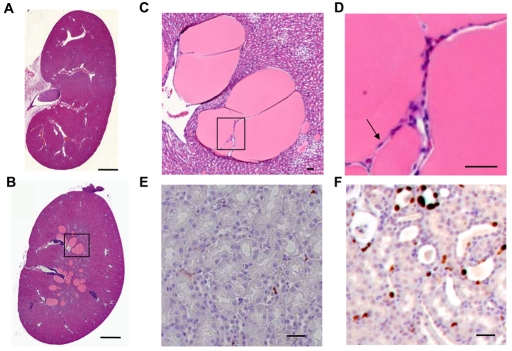
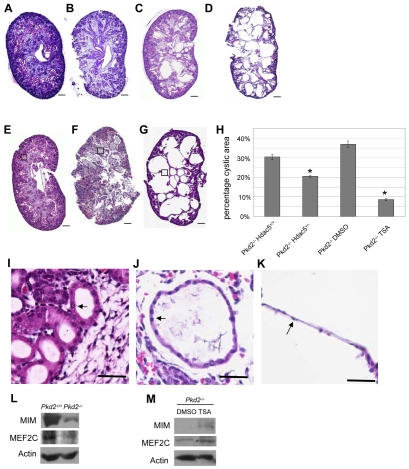
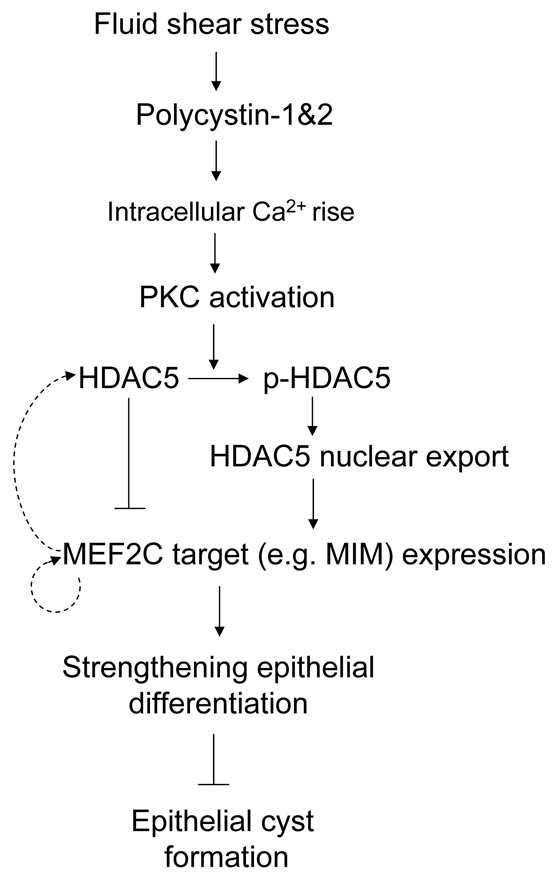
Polycystin 1 and polycystin 2 are large transmembrane proteins, which, when mutated, cause autosomal dominant polycystic kidney disease (ADPKD), a highly prevalent human genetic disease. The polycystins are thought to form a receptor-calcium channel complex in the plasma membrane of renal epithelial cells and elicit a calcium influx in response to mechanical stimulation, such as fluid flow across the apical surface of renal epithelial cells. The functional role of the polycystins in mechanosensation remains largely unknown. Here, we found that myocyte enhancer factor 2C (MEF2C) and histone deacetylase 5 (HDAC5), two key regulators of cardiac hypertrophy, are targets of polycystin-dependent fluid stress sensing in renal epithelial cells in mice. We show that fluid flow stimulation of polarized epithelial monolayers induced phosphorylation and nuclear export of HDAC5, which are crucial events in the activation of MEF2C-based transcription. Kidney-specific knockout of Mef2c, or genetrap-inactivation of a MEF2C transcriptional target, MIM, resulted in extensive renal tubule dilation and cysts, whereas Hdac5 heterozygosity or treatment with TSA, an HDAC inhibitor, reduced cyst formation in Pkd2(-/-) mouse embryos. These findings suggest a common signaling motif between myocardial hypertrophy and maintenance of renal epithelial architecture, and a potential therapeutic approach to treat ADPKD.


Figures

Fig. 1.
Fig. 1.
Fluid flow-induced HDAC5 phosphorylation in MEK cells. (A) Immunoblot analysis of HDAC5 phosphorylation using a phospho-specific antibody against serine 489 after Pkd1+/+ and Pkd1−/− MEK cells were stimulated with fluid flow at 0.2 ml/minute for up to 4 hours. (B) Quantification of HDAC5 phosphorylation in the above experiment, normalized first against actin and then against the t0 values. (C) Immunoblot analysis of HDAC5 phosphorylation in response to fluid flow for 4 hours in Pkd1 siRNA or control lentivirus-transduced MEK cells. (D)Effects of a PKC activator (PMA), a PKC inhibitor (GÖ6983), a calcium ionophore (ionomycin) and a calcium channel blocker (GdCl3) on HDAC5 phosphorylation with or without fluid flow in MEK cells.
Fig. 2.
Fig. 2.
Fluid flow-induced HDAC5 nuclear export in MEK cells. (A) Pkd1+/+ and Pkd1−/− MEK cells co-transfected with FLAG-MEF2C (red) and HDAC5-GFP (green) were stimulated with fluid flow at 0.2 ml/minute for 30 minutes (no-flow controls are also included). The cells were fixed, stained and imaged using confocal microscopy. (B) Time-lapse images of HDAC5-GFP translocation stimulated by fluid flow. Time (minutes) after flow initiation is indicated on each panel. The graph shows quantification of fluorescence ratio (nuclear/cytosolic) over time. (C) Quantification of HDAC5-GFP distribution in the cytosol or nucleus in Pkd1+/+ and Pkd1−/− cells with or without fluid flow stimulation, in the presence of GdCl3 and HDAC5S250/S489A mutations as indicated. Percentages of cells (over total) with HDAC5-GFP in the nucleus or cytosol or in both compartments are shown. (D) Quantification of HDAC5-GFP distribution in the cytosol or nucleus in cells treated with DMSO (solvent control), 100 nM PMA or 10 μM Gö 6983 in the absence or presence of fluid flow, as indicated. For both C and D, more than 600 cells were counted for each experimental condition. Shown are the average and s.e.m. from three independent experiments. Scale bars: 16 μm.
Fig. 3.
Fig. 3.
MIM is a transcriptional target of MEF2C and HDAC5. (A) Chromatin immunoprecipitation (ChIP) demonstrating that MEF2C and HDAC5 bind to the promoter region of MIM. FLAG-MEF2C or FLAG-HDAC5 were transfected into wild-type MEK cells, which were either resting (−flow) or stimulated with fluid flow for 0.5 hours (+flow), and an anti-FLAG antibody was used for ChIP. PCR was performed using primers in the MIM promoter region as explained in Materials and methods. Input is DNA template before ChIP. Ctrl is ChIP using MEK cells transfected with the empty FLAG vector. In two independent experiments, each with three independent cultures for flow and non-flow conditions, binding of FLAG-HDAC5 appeared to be reduced in flow-stimulated samples compared with that in the non-flow samples; however, this difference could not be quantified as ChIP is non-quantitative owing to the PCR amplification step. (B) MEF2C is important for normal MIM expression in MEK cells. RNAi knockdown of MEF2C in Pkd1+/+ MEK cells led to reduced MIM expression, quantified by qPCR. The results shown are averages of three experiments. Ctrl, cells transfected with control siRNA. Error bars indicate ± s.d. (C) Reconstitution of MIM reporter expression in Pkd1−/− MEK cells. Luciferase activity averaged from three experiments are shown for Pkd1−/− cells tranfected with either empty vector (Ctrl), MEF2C alone, GATA6 alone, or MEF2C and GATA6 together. **, P<0.05 compared with control. Error bars indicate s.d. (D) HDAC5 negatively regulates MIM expression in MEK cells. Immunoblot and quantification show that HDAC5 S250/489A-GFP overexpression reduced MIM expression in Pkd1+/+ MEK cells.
Fig. 4.
Fig. 4.
Kidney specific knock-out of Mef2C resulted in epithelial tubule dilations/cysts. (A-I) Kidneys from 5- to 6-month-old Mef2Cloxp/loxP Sglt2-Cre mice and their congenic wild-type controls were fixed in 4% formaldehyde, sectioned (5 μm) and stained with Hematoxylin and Eosin (A-G), tubule markers (H) or Ki67 (I). (A) A representative section of wild-type kidney. (B) A representative kidney section from a Mef2Cloxp/loxp Sglt2-Cre mouse. (C) Magnified region corresponding to the box in A. (D) Magnified region corresponding to the box in B, which reveals a broad distribution of dilated tubules (arrows). (E) A 40× magnified cortex region in wild-type mouse kidney, showing normal epithelial tubules. (F) A 40× magnified cortex region of a Mef2Cloxp/loxP Sglt2-Cre kidney, revealing dilated tubules and small cysts with flat lining cells (arrows). (G) Glomerular cysts (arrows) in a Mef2Cloxp/loxP Sglt2-Cre kidney. (H) Staining of wild-type and Mef2Cloxp/loxP Sglt2-Cre kidney sections against DAPI (blue) and various tubule markers (green): Na+/K+ ATPase a-1 (distal tubule), LTA (proximal tubule) and DBA (collecting duct). Arrows point to dilated tubules/cysts. (I) Representative Ki67 staining of wild-type and Mef2Cloxp/loxP Sglt2-Cre kidney sections, showing increased cell proliferation in the mutant kidney section. Scale bars: 1000 μm in A,B; 200 μm in C,D; 50 μm in E-G,I; 100 μm in H.
Fig. 5.
Fig. 5.
MIM is required for normal renal epithelial organization. (A,B) Representative histology sections of wild-type (A) and MIM−/− (B) kidneys from 5-month-old mice. (C) A magnified image of the boxed region in B. (D) A magnified image of cyst lining cells (arrow) in the boxed region in C. (E,F) Representative Ki67 staining of wild-type (E) and MIM−/− (F) kidney sections, showing increased cell proliferation in the mutant kidney section. Scale bars: 1000 μm in A,B; 50 μm in C-F.
Fig. 6.
Fig. 6.
Effects of Hdac5 genetic or chemical inactivation on cyst formation in Pkd2−/− embryonic kidneys. (A-D) Representative embryonic kidney sections from E18.5 embryos of different genotypes. A, Pkd2+/+ Hdac5+/+; B, Pkd2+/+ Hdac5−/−; C, Pkd2−/− Hdac+/−; D, Pkd2−/− Hdac5+/+. (E-G) Representative histology sections of E18.5 Pkd2+/+ and Pkd2−/− embryonic kidneys from pregnant mothers injected with TSA or control solvent (DMSO) from 10.5 dpc to 18.5 dpc. E, Pkd2+/+ from TSA-treated mother; F, Pkd2−/− from TSA-treated mother; G, Pkd2−/− from DMSO-treated mother. (H) Quantification of the percentage of cystic areas over total kidney section areas of different genotypes or treatment, as indicated. The middle section of each kidney was quantified for all mice under each condition. Shown are mean and s.e.m. of all sections quantified for each condition. Asterisks, P<0.05 compared with the control to the left. (I-K) Magnified images of the box regions in E, F and G, respectively. Lining cells around a normal tubule (I), small cyst (J) and large cyst (K) are indicated by arrows. (L) Immunoblots showing reduced MIM and MEF2C expression in 18.5 dpc Pkd2−/− embryonic kidneys. (M) TSA stimulates MIM and MEF2C expression in Pkd2−/− embryonic kidneys. Scale bars: 200 μm in A-G; 50 μm in I-K.
Fig. 7.
Fig. 7.
A schematic diagram depicting a pathway that connects polycystins and calcium signaling to HDAC5 and MEF2C-based transcription activation in the suppression of epithelial cyst formation. Fluid flow through lumens of renal tubules activates the polycystin 1 and 2 receptor-calcium channel complex. Downstream of the intracellular calcium rise, active PKC directly or indirectly causes phosphorylation of HDAC5 and its export from the nucleus, enabling activation of MEF2C-regulated transcripts, which probably encode proteins that maintain the normal differentiated state of renal epithelial cells. The observed increase of HDAC5 and MEF2C transcript levels in our microarray analysis might be explained by feedback loops, depicted with dotted lines.

References

    1. Azzam R., Chen S. L., Shou W., Mah A. S., Alexandru G., Nasmyth K., Annan R. S., Carr S. A., Deshaies R. J. (2004). Phosphorylation by cyclin B-Cdk underlies release of mitotic exit activator Cdc14 from the nucleolus. Science 305, 516-519 - PubMed
    1. Battini L., Macip S., Fedorova E., Dikman S., Somlo S., Montagna C., Gusella G. L. (2008). Loss of polycystin-1 causes centrosome amplification and genomic instability. Hum. Mol. Genet. 17, 2819-2833 - PMC - PubMed
    1. Berbari N. F., O'Connor A. K., Haycraft C. J., Yoder B. K. (2009). The primary cilium as a complex signaling center. Curr. Biol. 19, R526-R535 - PMC - PubMed
    1. Bhunia A. K., Piontek K., Boletta A., Liu L., Qian F., Xu P. N., Germino F. J., Germino G. G. (2002). PKD1 induces p21(waf1) and regulation of the cell cycle via direct activation of the JAK-STAT signaling pathway in a process requiring PKD2. Cell 109, 157-168 - PubMed
    1. Boletta A., Germino G. G. (2003). Role of polycystins in renal tubulogenesis. Trends Cell Biol. 19, 484-492 - PubMed

Publication types

MeSH terms