. 2010 Apr 15;21(8):1350-61.
doi: 10.1091/mbc.e09-09-0829. Epub 2010 Feb 24.

Arginylation regulates intracellular actin polymer level by modulating actin properties and binding of capping and severing proteins

Affiliations

Arginylation regulates intracellular actin polymer level by modulating actin properties and binding of capping and severing proteins

Sougata Saha et al. Mol Biol Cell. .

Abstract

Actin arginylation regulates lamella formation in motile fibroblasts, but the underlying molecular mechanisms are unknown. To understand how arginylation affects the actin cytoskeleton, we investigated the biochemical properties and the structural organization of actin filaments in wild-type and arginyltransferase (Ate1) knockout cells. We found that Ate1 knockout results in a dramatic reduction of the actin polymer levels in vivo accompanied by a corresponding increase in the monomer level. Purified nonarginylated actin has altered polymerization properties, and actin filaments from Ate1 knockout cells show altered interactions with several associated proteins. Ate1 knockout cells have severe impairment of cytoskeletal organization throughout the cell. Thus, arginylation regulates the ability of actin to form filaments in the whole cell rather than preventing the collapse of preformed actin networks at the cell leading edge as proposed in our previous model. This regulation is achieved through interconnected mechanisms that involve actin polymerization per se and through binding of actin-associated proteins.


Figures

Figure 1.
Figure 1.
Arginylation regulates actin polymer level in vivo. (A) Staining of wild-type (WT) and Ate1 knockout (KO) cells with rhodamine-phalloidin. (B) Frequency histogram showing the distribution of the total fluorescence levels in individual (left) and averaged (right) WT and Ate1 KO cells (n = 54; error bars, SD between the readings shown on the left; p < 0.0001). (C) Fractionation of actin from the lysates of WT and KO cells by high-speed centrifugation (see Figure S1 for the other centrifugation steps and Supplemental Table 1 for the percentages plotted in the diagrams). Bars show percentages of actin present in the supernatant (G-actin, light gray) and pellet (F-actin, dark gray) for total actin and individual actin isoforms, estimated by Western blot quantification using antibodies specific to total, β- and γ-actin, as labeled. Error bars, SD for two independent experiments. (D) Western blot analysis of WT and Ate1 KO cell lysates using antibody to total actin and β-tubulin as a loading control. Bars represent a quantification of total actin adjusted to the loading control, averaged from three independent experiments. (E) Percentage of total, β- and γ-actin in the lower speed centrifugation steps (representing bundles and aggregates) calculated from the centrifugation steps shown in C and in Figure S1. Error bars, SD for two independent experiments. See also Supplemental Table 1 for the percentages used to obtain the bar diagrams shown in C and E.
Figure 2.
Figure 2.
Arginylation regulates polymerization properties of pure actin. (A) Coomassie blue–stained SDS-PAGE of actin purified from WT and Ate1 KO fibroblasts. (B) Left, sedimentation-based actin polymerization assay using lower actin concentrations to determine the critical concentration for polymerization. To perform the assay, actin at each concentration was polymerized at room temperature for 4 h, followed by centrifugation at 100,000 × g for 1 h at 17°C and quantification of actin in the pellets by SDS-PAGE and Coomassie blue staining. Inset, the Coomassie blue–stained SDS-PAGE of the sedimented actin, which was quantified and plotted against the corresponding actin concentrations on the graph. Right, actin polymerization rates measured using a pyrene actin assay. The assembly rates derived as the slopes of the individual pyrene actin curves in the rapid growth phase were plotted against the corresponding concentrations of actin. The critical concentration values (denoted with an asterisk) were plotted on the graph as determined in sedimentation assays (left). Data were combined from two independent experiments. (C) Pyrene actin polymerization assay in the presence of seeds to determine the elongation rate. G-Actin concentration used to obtain the curve was 5 μm. See Figure S2 for the curves at other actin concentrations. (D) Left, rhodamine-phalloidin staining of filaments polymerized from arginylated (R) and nonarginylated (M) actin. Scale bar, 20 μm. Right, average lengths of filaments formed from M- and R-actin determined by measuring images shown on right. Error bars, SD for 100 measurements (p < 0.0001).
Figure 3.
Figure 3.
Purified arginylation-free actin forms bundles and aggregates that are structurally distinct from normal filaments. (A) Negative staining EM images of actin filaments polymerized from pure WT (left column) and KO (right column) actin. Scale bars, 100 nm. (B) Sucrose density gradient fractionation of actin filaments polymerized from actins purified from WT and KO cells. Top, gel of the gradient fractions and protein level profile across the gradient. Bottom, negative staining EM images of the gradient peak (fraction 10) and bottom (fraction 25). Error bars, SD for two experiments.
Figure 4.
Figure 4.
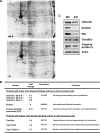
Arginylation regulates ABPs and their interaction with F-actin. (A) Silver-stained 2D gels of actin filaments in complex with ABP obtained from WT and Ate1 KO fibroblasts by phalloidin-induced polymerization in clarified cell lysates followed by sedimentation. Gel pH range is 4.5–10, increasing left to right. Spots corresponding to those circled in the figure were excised from similarly run Coomassie-stained 2D gels and identified by mass spectrometry as (1) drebrin, (2) gelsolin, (3) PDI, (4) twinfilin, (5) capping protein α, and (6) capping protein β. (B) Table with identified proteins that are altered between the two gels. Fold-change p-values determined by Student's t test generated by gel comparison software based on the analysis of duplicate silver-stained gels were as follows: gelsolin spot A, 0.001; gelsolin spot B, 0.015; gelsolin spot C, 0.002; drebrin, 0.015; PDI, 0.028; twinfilin, 0.240; capping protein β, 0.041; and capping protein α, 1: 0.061. (C) Western blot analysis of WT and Ate1 KO total cell lysates.
Figure 5.
Figure 5.
Arginylation regulates gelsolin–actin binding and gelsolin-induced severing of the actin filaments. (A) Cosedimentation assays in the presence of low Ca2+ at increasing gelsolin–actin ratios confirm that gelsolin binding to WT actin is stronger than to KO actin. Error bars, SEM of three independent measurements. Two-tailed unpaired t test; p < 0.0001 for 50 nM gelsolin, 0.0019 for 100 nM gelsolin, and 0.0412 for 200 nM gelsolin. (B) Cosedimentation assays in the presence of high Ca2+ (evidenced by the severing-dependent reduction of pelleting of WT actin in the presence of gelsolin) show higher severing activity of gelsolin toward WT actin. Error bars, SEM of four independent measurements; p = 0.0458.
Figure 6.
Figure 6.
Arginylation regulates actin network density and organization at the leading edge of the motile cells. Electron micrographs of the platinum replicas of the cytoskeleton in WT and Ate1 KO fibroblasts. (A and B) WT and Ate1 KO cell replicas at low magnification. (A1, A2, B1, and B2) Higher magnification images of the areas boxed in A and B, respectively, and represent the cell interior (A1 and B1) and leading edge (A2 and B2) from the WT and KO cells shown on the left. (C and D) Higher resolution images of lamellipodia from WT and Ate1 KO cells depicting the structural organization of actin network in these cells at the leading edge. Inset in B1, an enlarged image of a protein aggregate. Scale bars, (A and B) 10 μm and (A1, A2, B1, B2, C and D) 500 nm.
Figure 7.
Figure 7.
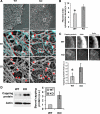
Absence of arginylation increases capping protein binding and the number of filament ends in the leading edge actin network. (A) Top, electron micrographs of platinum replicas of the lamellipodial actin network in a WT and a KO cell with filament ends marked as white dots. Middle, stereo electron micrographs of the magnified regions boxed in the top panels, showing individual actin filament ends. (Red-cyan glasses should be used to view these images, with red on the left eye). Bottom, electron micrographs of the same regions as in the middle panels without the stereo effect, with actin filament ends marked by red asterisks. Scale bars, 500 nm. (B) Bar diagram showing the average number of visible filament ends normalized to total cytoskeleton density and averaged from three different images (error bars, SD; p = 0.0136). (C) Top, areas of the leading edge in WT and KO cells stained with an antibody to the capping protein (left panels) and actin, presented as identically scaled images to show the difference in the actin intensity between WT and KO (middle panels), and the images of the same area adjusted to the optimal brightness for each condition (right panels). Bottom, quantification of the ratios of capping protein to actin in WT and KO cells (error bars, SD of measurements from 32 WT and 31 KO cells; p < 0.0001). (D) Western blot and quantification of the levels of purified capping protein bound to WT and KO F-actin in an in vitro sedimentation assay. Error bars, the average of three independent measurements; two-tailed unpaired t test; p = 0.0534.
Figure 8.
Figure 8.
Arginylation is required for lamella formation, cell spreading, and locomotion. In a normal cell, arginylated actin facilitates the formation of a proper leading edge network and normal actin structures throughout the cell. Absence of arginylation results in actin forming abnormal aggregates, which are sequestered and disassembled back into the monomer pool, causing the overall reduction of the amount of the actin polymer. Increased binding of capping proteins further lowers the polymer levels, and decreased gelsolin-dependent actin turnover contributes to the cytoskeletal abnormalities, resulting in a scarce and disorganized actin network in the cell body and at the leading edge. These effects result in reduced cell spreading and lamella collapse, causing severe impairments in cell migration.

Similar articles

Cited by

References

    1. Balzi E., Choder M., Chen W. N., Varshavsky A., Goffeau A. Cloning and functional analysis of the arginyl-tRNA-protein transferase gene ATE1 of Saccharomyces cerevisiae. J. Biol. Chem. 1990;265:7464–7471. - PubMed
    1. Burtnick L. D., Koepf E. K., Grimes J., Jones E. Y., Stuart D. I., McLaughlin P. J., Robinson R. C. The crystal structure of plasma gelsolin: implications for actin severing, capping, and nucleation. Cell. 1997;90:661–670. - PubMed
    1. Carlier M. F., Pantaloni D. Control of actin dynamics in cell motility. J. Mol. Biol. 1997;269:459–467. - PubMed
    1. Cooper J. A., Pollard T. D. Methods to measure actin polymerization. Methods Enzymol. 1982;85(Pt B):182–210. - PubMed
    1. Cooper J. A., Schafer D. A. Control of actin assembly and disassembly at filament ends. Curr. Opin. Cell Biol. 2000;12:97–103. - PubMed

Publication types

LinkOut - more resources