. 2010 Apr 15;21(8):1409-22.
doi: 10.1091/mbc.e09-06-0451. Epub 2010 Feb 24.

h3/Acidic calponin: an actin-binding protein that controls extracellular signal-regulated kinase 1/2 activity in nonmuscle cells

Affiliations

h3/Acidic calponin: an actin-binding protein that controls extracellular signal-regulated kinase 1/2 activity in nonmuscle cells

Sarah Appel et al. Mol Biol Cell. .

Abstract

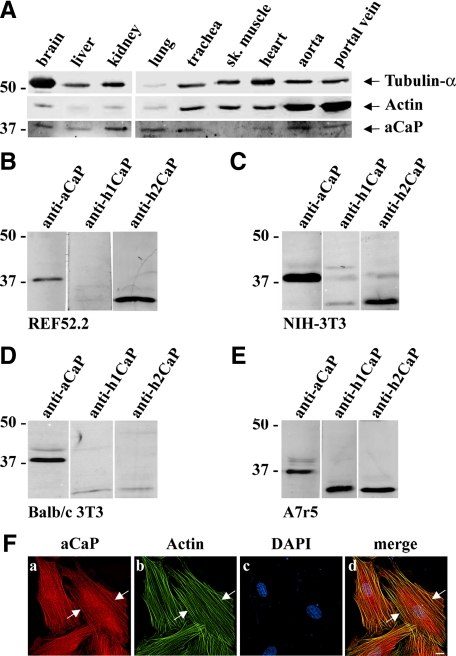
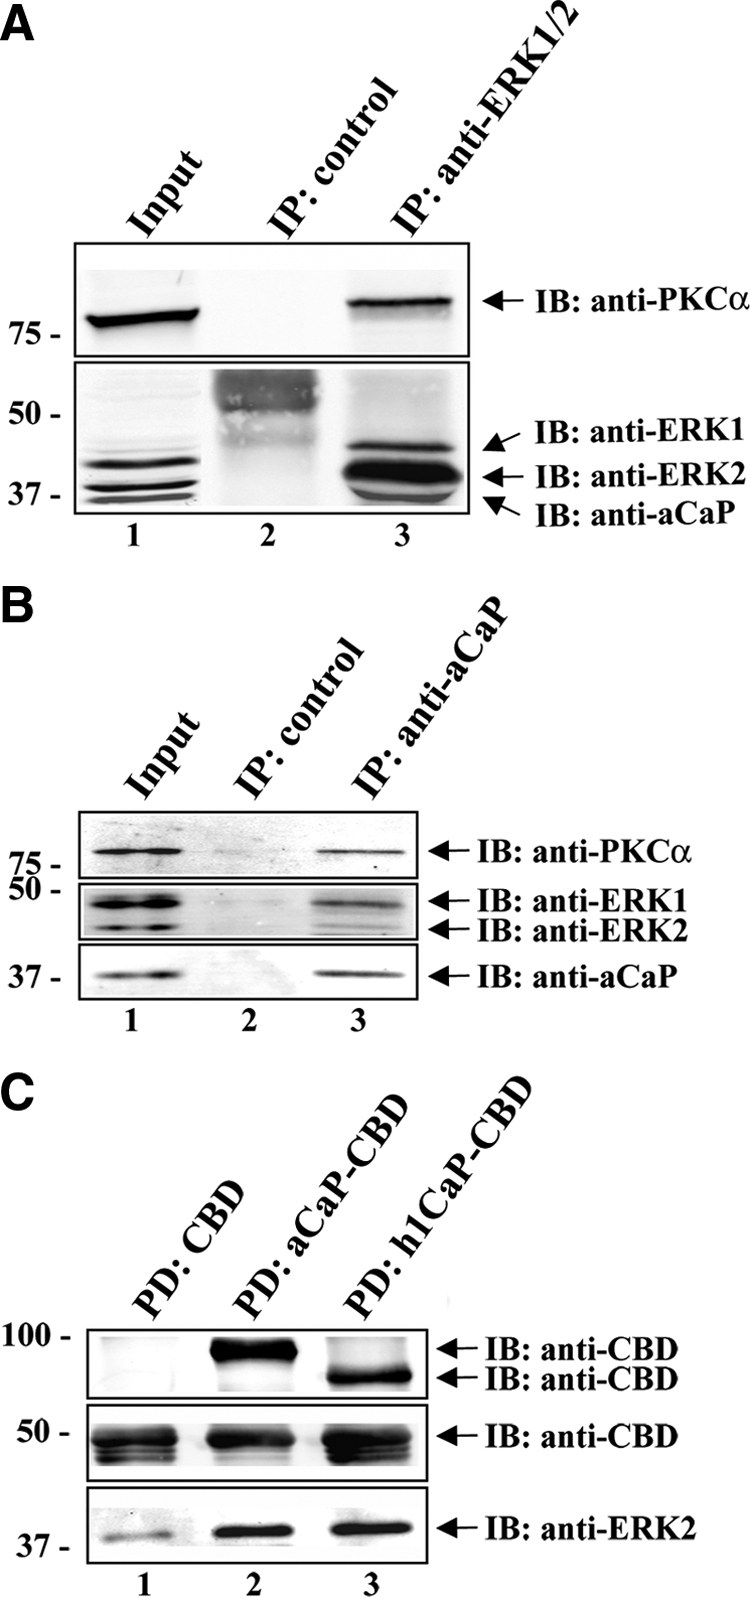
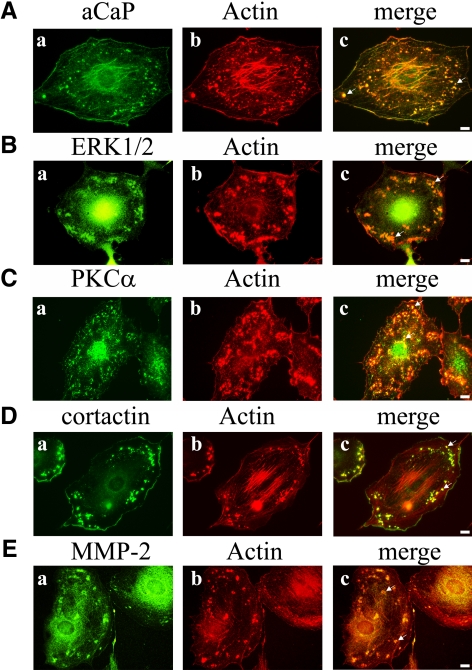
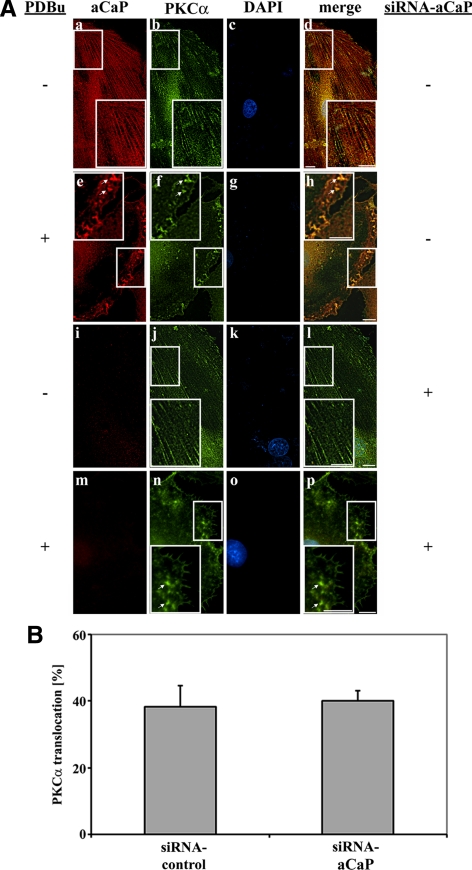
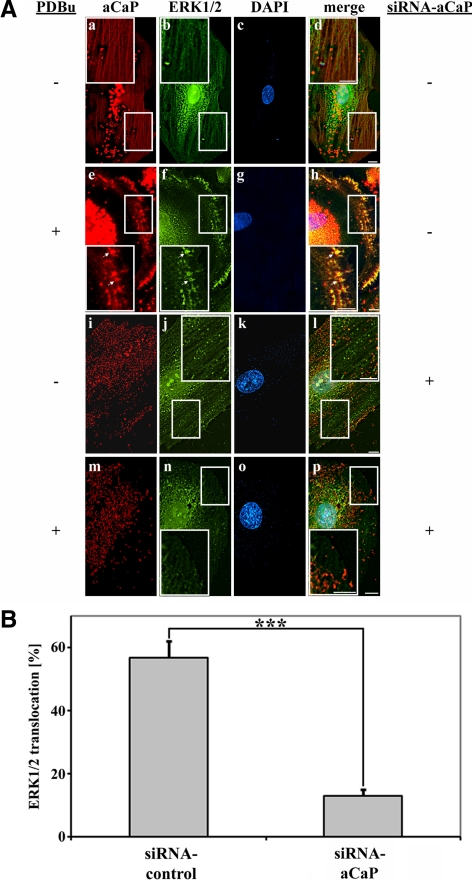
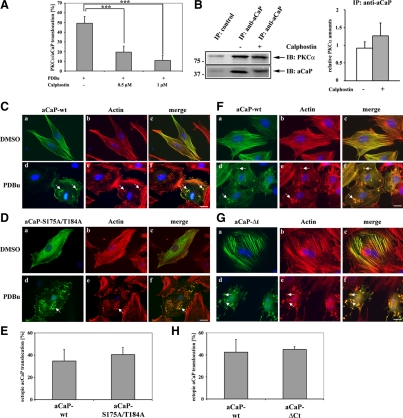
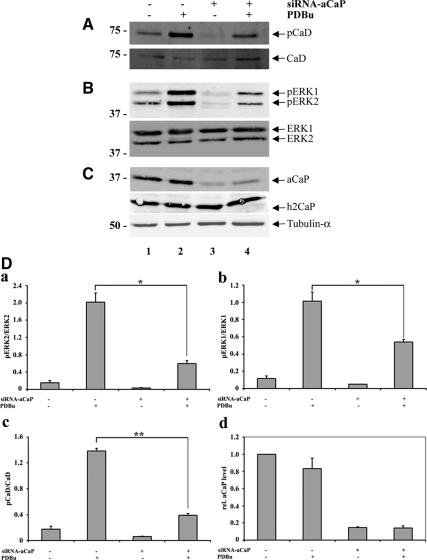
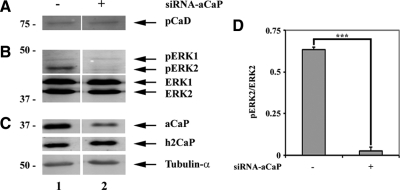
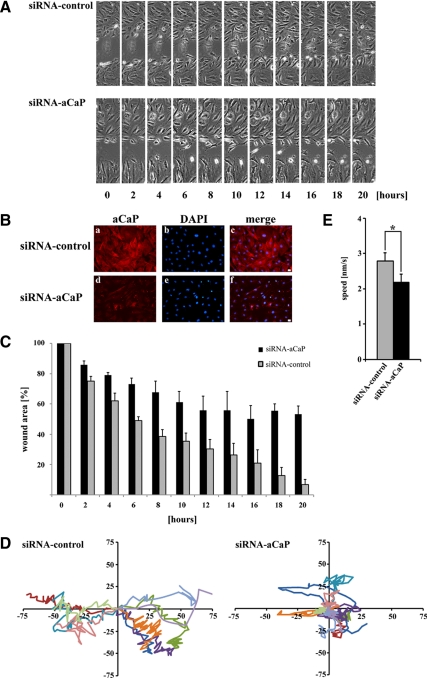
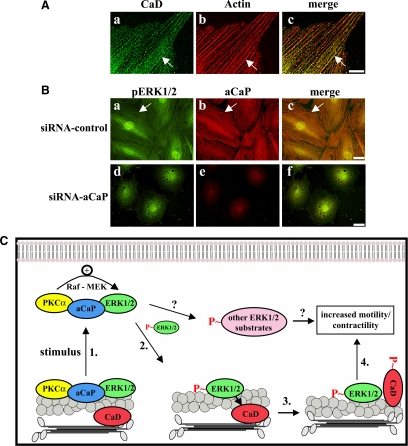
Migration of fibroblasts is important in wound healing. Here, we demonstrate a role and a mechanism for h3/acidic calponin (aCaP, CNN3) in REF52.2 cell motility, a fibroblast line rich in actin filaments. We show that the actin-binding protein h3/acidic calponin associates with stress fibers in the absence of stimulation but is targeted to the cell cortex and podosome-like structures after stimulation with a phorbol ester, phorbol-12,13-dibutyrate (PDBu). By coimmunoprecipitation and colocalization, we show that extracellular signal-regulated kinase (ERK)1/2 and protein kinase C (PKC)alpha constitutively associate with h3/acidic calponin and are cotargeted with h3/acidic calponin in the presence of PDBu. This targeting can be blocked by a PKC inhibitor but does not require phosphorylation of h3/acidic calponin at the PKC sites S175 or T184. Knockdown of h3/acidic calponin results in a loss of PDBu-mediated ERK1/2 targeting, whereas PKCalpha targeting is unaffected. Caldesmon is an actin-binding protein that regulates actomyosin interactions and is a known substrate of ERK1/2. Both ERK1/2 activity and nonmuscle l-caldesmon phosphorylation are blocked by h3/acidic calponin knockdown. Furthermore, h3/acidic calponin knockdown inhibits REF52.2 migration in an in vitro wound healing assay. Our findings are consistent with a model whereby h3/acidic calponin controls fibroblast migration by regulation of ERK1/2-mediated l-caldesmon phosphorylation.


Figures

Figure 1.
Figure 1.
Expression level and intracellular localization of h3/acidic CaP. (For brevity, the abbreviation aCaP is used for h3/acidic CaP in all figures.) (A) A ferret multiple tissue Western blot was stained with antibodies against PAN-actin, tubulin-α, and h3/acidic CaP (aCaP). (B–E) Whole cell lysates (50 μg) of rat REF52.2 (B), mouse NIH-3T3 (C), mouse BALB/c 3T3 (D), and rat A7r5 (E) cells were analyzed by SDS-PAGE and subsequent Western blotting with specific antibodies against h3/acidic CaP (aCaP), h1CaP, or h2CaP as indicated. (F) REF52.2 cells were stained with the h3/acidic CaP-specific antibody used in A–E (a) and with Al488-labeled phalloidin (b) to detect actin filaments. Images were obtained with deconvolution microscopy. The yellow signals in the merged image (d) indicate colocalization. Bar, 10 μm.
Figure 2.
Figure 2.
Interaction studies with h3/acidic CaP, ERK1/2, and PKCα. (A) REF52.2 whole cell lysates were subjected to coimmunoprecipitation by using the rabbit polyclonal anti-ERK1/2 antibody coupled to protein A agarose (lane 3). For negative control, lysates were incubated with rabbit IgG coupled to protein A agarose (lane 2). The immunoprecipitated proteins were separated on an 8.5% SDS-PAGE. A lysate input control (10 μg of total protein) was loaded in lane 1. Arrows indicate the positions of PKCα, ERK1, ERK2, and aCaP. A typical Western blot is shown here, and the experiment was repeated three times. (B) Lysates of REF52.2 cells were incubated with the specific h3/acidic CaP antibody (lane 3) cross-linked to protein G-coupled Dynabeads. Lysates incubated with the GFP-antibody cross-linked to protein G-coupled Dynabeads served as negative control (lane 2). Proteins were eluted from the beads and subsequently analyzed by Western blotting. Ten micrograms of total protein of the lysate was loaded as input (lane 1). Arrows indicate the positions of PKCα, ERK1, ERK2, and aCaP. A typical Western blot is shown here, and the experiment was repeated three times. (C) Recombinant h3/acidic CaP-CBD (aCaP-CBD; lane 2), h1CaP-CBD (lane 3), or the CBD tag alone (lane 1), bound to chitin beads were used in an in vitro pull-down assay to probe for direct interaction with recombinant ERK2 protein. Precipitated proteins were eluted from the chitin beads and analyzed by Western blotting. The membrane was immunostained with an anti-CBD antibody and the polyclonal anti-ERK1/2 antibody.
Figure 3.
Figure 3.
Translocation of h3/acidic CaP, ERK1/2, and PKCα to podosome-like structures and the cortex in PDBu-treated rat fibroblast cells. REF52.2 fibroblasts were grown on glass coverslips and then stimulated with 1 μM PDBu for 30 min. After fixation with paraformaldehyde, cells were immunofluorescently labeled with specific antibodies against aCaP (A, a), ERK1/2 (B, a), PKCα (C, a), cortactin (D, a), and MMP-2 (E, a). Actin filaments were visualized with Al568-labeled phalloidin (b). The yellowish signals in the merged images (c) indicate colocalization. Bar, 10 μm.
Figure 4.
Figure 4.
Knockdown of h3/acidic CaP does not affect PKCα targeting upon PDBu stimulation. (A) REF52.2 cells were transfected with siRNA against aCaP siRNA (i–p) or nontargeting control siRNA (a–h). Three days after transfection, cells were treated with 0.01% DMSO for control (a–d and i–l) or with 1 μM PDBu for 30 min (e–f and m–p) before staining for aCaP (a, e, i, and m) and PKCα (b, f, j, and n) with the rabbit polyclonal anti-h3/acidic CaP and the mouse monoclonal anti-PKCα antibodies. Images were obtained with deconvolution microscopy. The yellowish signal in the merged images indicates colocalization (d, h, l, and p). Bar, 10 μm. (B) REF52.2 cells transfected with siRNA against h3/acidic CaP or with nontargeting control siRNA were treated with 1 μM PDBu for 30 min. After an immunofluorescence staining for h3/acidic CaP and PKCα, cells showing a PKCα translocation to either the cell cortex or podosome-like structures were counted. The graph represents three independent experiments, where at least 100 cells were counted.
Figure 5.
Figure 5.
Knockdown of h3/acidic CaP inhibits PDBu-mediated ERK1/2 targeting. (A) REF52.2 cells were transfected with siRNA against aCaP siRNA (i–p) or nontargeting control siRNA (a–h). Three days after transfection, cells were treated with DMSO for control (a–d and i–l) or with 1 μM PDBu for 30 min (e–f and m–p) before staining for aCaP (a, e, i, and m) and ERK1/2 (b, f, j, and n) with the rabbit polyclonal anti-h3/acidic CaP-Al555 and anti-ERK1/2-Alexa488 antibodies. Note that the background in images a, d, e, h, i, l, m, and p derives from uncoupled Alexa555 dye, which was resistant to extensive washing. Images were obtained with deconvolution microscopy. The yellowish signal in the merged images indicates colocalization (d, h, l, and p). Bar, 10 μm. (B) REF52.2 cells transfected with siRNA against h3/acidic CaP or with nontargeting control siRNA were treated with 1 μM PDBu for 30 min. After an immunofluorescence staining for h3/acidic CaP and ERK1/2, cells showing an ERK1/2 translocation to either the cell cortex or podosome-like structures were counted. The graph represents three independent experiments, where at least 100 cells were counted. Note that the difference is highly statistically significant in a two-tailed paired t test (p = 0.0001) marked by asterisks.
Figure 6.
Figure 6.
The C-terminal tail of h3/acidic CaP or h3/acidic CaP phosphorylation at Ser175 and/or Thr184 is not necessary for PDBu-mediated translocation, but can be blocked by a PKC inhibitor. (A) REF52.2 cells, grown on glass coverslips, were serum starved for 30 min, pretreated with either 0.5 or 1 μM calphostin or DMSO as control for 30 min, and then stimulated with 1 μM PDBu for 30 min. Endogenous aCaP and PKCα proteins were immunofluorescently labeled with the rabbit anti-h3/acidic CaP and the mouse anti-PKCα antibody. The percentage of cells showing a translocation of h3/acidic CaP/PKCα to the cell membrane/podosome-like structures was determined and graphed. Results are from three independent experiments. Note that the difference between DMSO pretreated control cells and both 0.5 μM calphostin (p = 0.0005) and 1 μM calphostin (p = 0.0001) pretreated cells is highly statistically significant. (B) Right, REF52.2 cells were treated with either DMSO as control (lane 2) or 1 μM calphostin (lane 3) for 30 min before preparing cell lysates. Lysates were incubated with the specific h3/acidic CaP antibody (lanes 2 and 3), and the immunocomplex was precipitated using protein G-coupled Dynabeads. Lysates incubated with the GFP-antibody served as negative control (lane 1). Proteins were eluted from the beads and subsequently analyzed by Western blotting. Arrows indicate the positions of PKCα and aCaP. A typical Western blot is shown here, and the experiment was repeated three times. Left, densitometry of all three Western blots showing the amount of PKCα coprecipitated together with h3/acidic CaP in the presence of calphostin (gray column) or DMSO as control (white column). The relative protein amount of PKCα was normalized to the relative amount of precipitated h3/acidic CaP. (C) REF52.2 cells were transfected with pFLAG-aCaP-wt, grown for 24 h, and then treated with DMSO as control (a–c) or 1 μM PDBu (d–f) for 30 min. The ectopically expressed FLAG-aCaP-wt protein was detected by immunofluorescence staining using the mouse monoclonal anti-FLAG antibody. Actin filaments were visualized with Alexa568-labeled phalloidin. Bar, 20 μm. (D) REF52.2 cells were transfected with pFLAG-aCaP-S175A/T184A and treated as described under A. Bar, 20 μm. (E) pFLAG-aCaP-wt or pFLAG-aCaP-S175A/T184A transfected cells, stimulated with 1 μM PDBu, were screened for translocation of the ectopically expressed proteins to the cell cortex/podosome-like structures. The percentage of cells showing a translocation is shown in the graph. The results are from three independent experiments, in each at least 100 cells were assessed. (F) REF52.2 cells were transfected with pEGFP-aCaP-wt, grown for 24 h and then treated with DMSO as control (a–c) or 1 μM PDBu (d–f) for 30 min. Actin filaments were visualized with Alexa568-labeled phalloidin. Bar, 20 μm. (G) REF52.2 cells were transfected with pEGFP-aCaP-ΔCt and treated as described under F. Bar, 20 μm. (H) pEGFP-aCaP-wt– or pEGFP-aCaP-ΔCt–transfected cells, stimulated with 1 μM PDBu, were screened for translocation of the ectopically expressed proteins to the cell cortex/podosome-like structures. The percentage of cells showing a translocation is shown in the graph. The results are from three independent experiments, in each at least 100 cells were assessed.
Figure 7.
Figure 7.
h3/acidic CaP knockdown inhibits ERK1/2 activation in REF52.2 cells. Seventy-two hours after transfection with siRNA against rat h3/acidic CaP (+, lanes 3 and 4) or with nontargeting control-siRNA (−, lanes 1 and 2), REF52.2 cells were treated with 1 μM PDBu for 30 min (+, lanes 2 and 4) or DMSO as solvent control (−, lanes 1 and 3). Fifty micrograms of whole cell extracts was analyzed by SDS-PAGE and Western blotting with specific antibodies. Arrows indicate the positions of (A) l-caldesmon (CaD), phospho-l-caldesmon (pCaD); (B) ERK1, phospho-ERK1 (pERK1), ERK2, phospho-ERK2 (pERK2); and (C) h3/acidic calponin (aCaP), neutral calponin (h2CaP) and tubulin-α. (D) Densitometric measurement of Western blots, derived from three independent experiments, was performed and total protein levels were normalized to tubulin-α. For phosphorylation levels of ERK1/2 and l-CaD, the ratio of phosphorylated to unphosphorylated protein was calculated and graphed (a–c). The decrease of phosphorylated ERK1 (b; p = 0.0195) and ERK2 (a; p = 0.0478) in h3/acidic CaP knockdown cells stimulated with PDBu was statistically significant, as was the difference of l-CaD phosphorylation (c; p = 0.0012). For relative h3/acidic CaP levels, the amount of h3/acidic CaP in nontargeting control-siRNA transfected and DMSO treated cells was set as 1, and relative h3/acidic CaP levels of the other three samples was calculated (d).
Figure 8.
Figure 8.
Knockdown of h3/acidic CaP decreases phospho-ERK2 levels in NIH-3T3 cells. NIH-3T3 cells were either transfected with nontargeting siRNA-control (lane 1) or siRNA against h3/acidic CaP (siRNA-aCaP; lane 2). Seventy-two hours after transfection, whole cell extracts were generated and examined by Western blotting. The membrane was stained with specific antibodies against (A) phospho-l-caldesmon (pCaD); (B) ERK1, phospho-ERK1 (pERK1), ERK2, phospho-ERK2 (pERK2); and (C) h3/acidic calponin (aCaP), neutral calponin (h2CaP) and tubulin-α as indicated. (D) Densitometric measurement of Western blots, derived from three independent experiments, was performed. Total protein levels were normalized to tubulin-α and the ratio of phosphorylated to unphosphorylated ERK2 protein was calculated and graphed. Note that the decrease of phosphorylated ERK2 (p = 0.00002) in h3/acidic CaP knockdown cells is highly statistically significant.
Figure 9.
Figure 9.
h3/acidic CaP enhances wound healing in REF52.2 cells in an in vitro assay. (A) REF52.2 cells were seeded on glass-bottomed culture plates and either transfected with siRNA against rat h3/acidic CaP (siRNA-aCaP) or with nontargeting control-siRNA the next day. Seventy-two hours after transfection, the cell layer was wounded with a sterile pipette tip, and the healing procedure was observed for 20 h. Bar, 20 μm. (B) To verify h3/acidic CaP knockdown, cells were immunostained after the in vitro wound healing assay for endogenous aCaP expression by using the rabbit polyclonal anti-h3/acidic CaP antibody. Bar, 20 μm. (C) To quantify in vitro wound healing, the wound area was measured using ImageJ software and calculated as a percentage of the wound area at 0 h. Data represent three independent experiments. (D) Ten single cells of each group (left, control cells; right, h3/acidic CaP knockdown cells) were manually traced using ImageJ software and migration tracks are shown as scatter plots. (E) The average speed of 30 individual cells in total, coming from three independent experiments, for either h3/acidic CaP knockdown or control cell groups was calculated and plotted in a graph bar. Note that the difference is statistically significant (p = 0.017).
Figure 10.
Figure 10.
Model of h3/acidic CaP function in the regulation of REF52.2 cell motility. (A) REF52.2 cells, cultured on glass coverslips, were fixed with paraformaldehyde and stained for CaD with the mouse monoclonal anti-caldesmon antibody and for actin with Alexa568-labeled phalloidin. Images were obtained with deconvolution microscopy. The yellowish color in c indicates colocalization. The arrow points out an example of colocalization. Bar, 20 μm. (B) REF52.2 cells, either transfected with nontargeting control-siRNA (top) or siRNA against h3/acidic CaP (siRNA-aCaP; bottom), were fixed 72 h after transfection and labeled for phospho-ERK1/2 (pERK1/2) using the mouse monoclonal phospho-ERK1/2–specific antibody (a) and for aCaP (b). Images were obtained with deconvolution microscopy and colocalization of phospho-ERK1/2 and h3/acidic CaP on filaments is indicated by the arrow in the merged image in c. Bar, 20 μm. (C) Model: PKCα, h3/acidic CaP (aCaP) and ERK1/2 are located in a complex at the actin filaments in untreated cells. 1. A stimulus such as PDBu leads to translocation of the PKCα–h3/acidic CaP–ERK1/2 complex to the cell cortex. Due to full activation of PKCα at the cell membrane, the kinase is now able to activate Raf, which in turn activates MEK, and MEK activates ERK1/2. 2. Activated ERK1/2 moves back to actin filaments where it binds and phosphorylates its substrate, CaD. 3. This leads to a conformational change in CaD, allowing interaction between actin and myosin filaments and thereby 4. Increasing contraction coupled to cell motility. From our experiments we can, however, not rule out the possibility that activated ERK1/2 phosphorylates other substrates such as MLCK (as indicated in the model with a question mark), which are also involved in regulating cell motility/contractility.

References

    1. Allen B. G., Walsh M. P. The biochemical basis of the regulation of smooth-muscle contraction. Trends Biochem. Sci. 1994;19:362–368. - PubMed
    1. Applegate D., Feng W., Green R. S., Taubman M. B. Cloning and expression of a novel acidic calponin isoform from rat aortic vascular smooth muscle. J. Biol. Chem. 1994;269:10683–10690. - PubMed
    1. Bruns R. F., Miller F. D., Merriman R. L., Howbert J. J., Heath W. F., Kobayashi E., Takahashi I., Tamaoki T., Nakano H. Inhibition of protein kinase C by calphostin C is light-dependent. Biochem. Biophys. Res. Commun. 1991;176:288–293. - PubMed
    1. Burgstaller G., Kranewitter W. J., Gimona M. The molecular basis for the autoregulation of calponin by isoform-specific C-terminal tail sequences. J. Cell Sci. 2002;115:2021–2029. - PubMed
    1. Cacace A. M., Ueffing M., Philipp A., Han E. K., Kolch W., Weinstein I. B. PKC epsilon functions as an oncogene by enhancing activation of the Raf kinase. Oncogene. 1996;13:2517–2526. - PubMed

Publication types

MeSH terms