

Quantification and mechanisms of oleic acid-induced steatosis in HepG2 cells
- PMID: 20182586
- PMCID: PMC2826826
Quantification and mechanisms of oleic acid-induced steatosis in HepG2 cells
Abstract
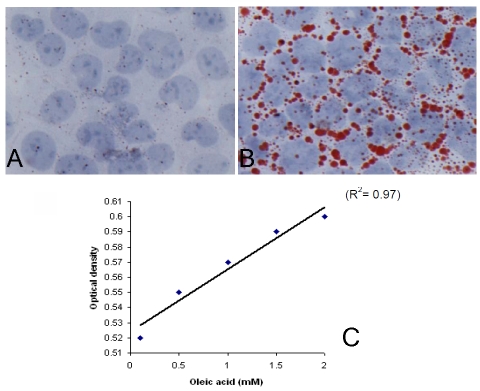
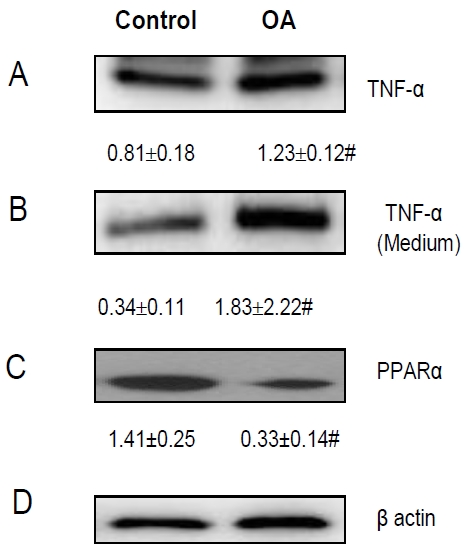
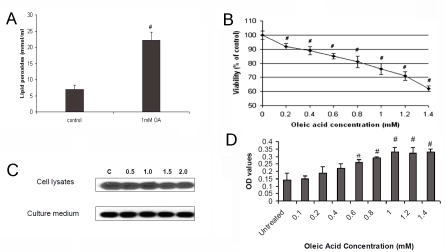
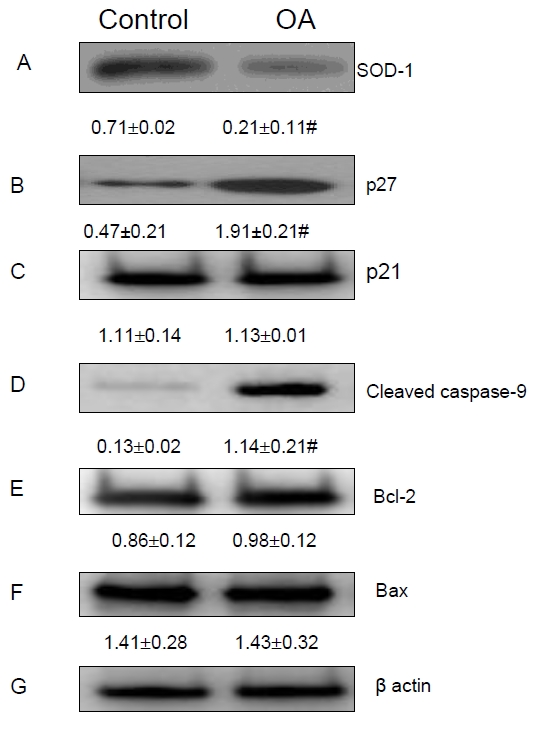
Developing a quantifiable in vitro model of steatosis is critical in understanding the pathogenesis of nonalcoholic fatty liver disease (NAFLD) and searchingfor effective therapies. Using an ORO-based colorimetric measurement, we developed a convenient assay to qualify the degree of OA-induced steatosis in HepG2 cells. We demonstrated that in the absence of exogenous inflammatory mediators, OA-induced steatosis was associated with increased production and secretion of tumor necrosis factor alpha and decreased expression of peroxisome proliferators-activated receptor alpha in HepG2 cells. OA-induced steatosis was also associated with increased lipid peroxidation, apoptosis, but decreased proliferation in these cells. The increased lipid peroxidation was related to decreased SOD-1, a free radical scavenger enzyme; while increased apoptosis was related to increased active caspase-9. The decreased proliferation mediated by OA-induced steatosis was associated with increased production of p27 with unchanged alanine transaminase (ALT) level in the culture medium, indicating OA-induced steatosis alters cell cycle progression without direct toxicity to these cells. In conclusion, the present study developed a colorimetric assay that accurately quantifies OA-induced steatosis in HepG2 cells. In the absence of exogenous inflammatory mediators, OA-induced steatosis results in a series of pathophysilogical changes in HepG2 cells, indicating direct pathogenic roles of hepatocytes in NAFLD.
Keywords: Steatosis; apoptosis; cell proliferation; lipid peroxidation; peroxisome proliferators-activated receptor α; tumor necrosis factor α.
Figures
Similar articles
-
Quercetin ameliorate insulin resistance and up-regulates cellular antioxidants during oleic acid induced hepatic steatosis in HepG2 cells.Toxicol In Vitro. 2013 Mar;27(2):945-53. doi: 10.1016/j.tiv.2013.01.014. Epub 2013 Jan 21. Toxicol In Vitro. 2013. PMID: 23348005
-
Monascin and ankaflavin act as natural AMPK activators with PPARα agonist activity to down-regulate nonalcoholic steatohepatitis in high-fat diet-fed C57BL/6 mice.Food Chem Toxicol. 2014 Feb;64:94-103. doi: 10.1016/j.fct.2013.11.015. Epub 2013 Nov 22. Food Chem Toxicol. 2014. PMID: 24275089
-
[Effect of metformin on mitochondrial pathway of apoptosis and oxidative stress in cell model of nonalcoholic fatty liver disease].Zhonghua Gan Zang Bing Za Zhi. 2020 Jan 20;28(1):64-68. doi: 10.3760/cma.j.issn.1007-3418.2020.01.015. Zhonghua Gan Zang Bing Za Zhi. 2020. PMID: 32023702 Chinese.
-
Liv.52 up-regulates cellular antioxidants and increase glucose uptake to circumvent oleic acid induced hepatic steatosis in HepG2 cells.Phytomedicine. 2012 Oct 15;19(13):1156-65. doi: 10.1016/j.phymed.2012.08.005. Epub 2012 Aug 30. Phytomedicine. 2012. PMID: 22940028
-
Free radical biology for medicine: learning from nonalcoholic fatty liver disease.Free Radic Biol Med. 2013 Dec;65:952-968. doi: 10.1016/j.freeradbiomed.2013.08.174. Epub 2013 Aug 29. Free Radic Biol Med. 2013. PMID: 23994574 Review.
Cited by
-
Drug-induced steatohepatitis.Expert Opin Drug Metab Toxicol. 2017 Feb;13(2):193-204. doi: 10.1080/17425255.2017.1246534. Epub 2016 Oct 27. Expert Opin Drug Metab Toxicol. 2017. PMID: 27759439 Free PMC article. Review.
-
Hepatoprotective effect of resveratrol against ethanol-induced oxidative stress through induction of superoxide dismutase in vivo and in vitro.Exp Ther Med. 2016 Apr;11(4):1231-1238. doi: 10.3892/etm.2016.3077. Epub 2016 Feb 16. Exp Ther Med. 2016. PMID: 27073428 Free PMC article.
-
Overexpression of variant PNPLA3 gene at I148M position causes malignant transformation of hepatocytes via IL-6-JAK2/STAT3 pathway in low dose free fatty acid exposure: a laboratory investigation in vitro and in vivo.Am J Transl Res. 2016 Mar 15;8(3):1319-38. eCollection 2016. Am J Transl Res. 2016. PMID: 27186262 Free PMC article.
-
Resveratrol Treatment Enhances the Cellular Response to Leptin by Increasing OBRb Content in Palmitate-Induced Steatotic HepG2 Cells.Int J Mol Sci. 2019 Dec 12;20(24):6282. doi: 10.3390/ijms20246282. Int J Mol Sci. 2019. PMID: 31842467 Free PMC article.
-
Lipid lowering effects of iodothyronines: In vivo and in vitro studies on rat liver.World J Hepatol. 2014 Apr 27;6(4):169-77. doi: 10.4254/wjh.v6.i4.169. World J Hepatol. 2014. PMID: 24799985 Free PMC article. Review.
References
-
- Angulo P. Nonalcoholic fatty liver disease. N Engl J Med. 2002;346:1221–1231. - PubMed
-
- Neuschwander-Tetri BA, Caldwell SH. Nonalcoholic steatohepatitis: summary of an AASLD Single Topic Conference. Hepatology. 2003;37:1202–1219. - PubMed
-
- Araya J, Rodrigo R, Videla LA, Thielemann L, Orellana M, Pettinelli P, Poniachik J. Increase in long-chain polyunsaturated fatty acid n - 6/n -3 ratio in relation to hepatic steatosis in patients with non-alcoholic fatty liver disease. Clin Sci (Lond) 2004;106:635–643. - PubMed
-
- Okamoto Y, Tanaka S, Haga Y. Enhanced GLUT2 gene expression in an oleic acid-induced in vitro fatty liver model. Hepatol Res. 2002;23:138–144. - PubMed
LinkOut - more resources
Full Text Sources
Miscellaneous