

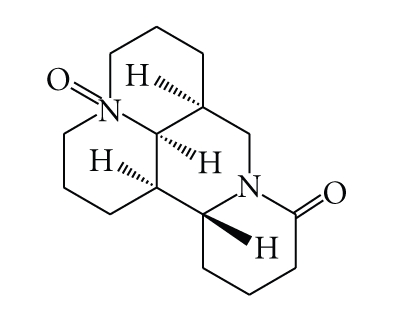
Oxymatrine downregulates TLR4, TLR2, MyD88, and NF-kappaB and protects rat brains against focal ischemia
- PMID: 20182634
- PMCID: PMC2825667
- DOI: 10.1155/2009/704706
Oxymatrine downregulates TLR4, TLR2, MyD88, and NF-kappaB and protects rat brains against focal ischemia
Abstract
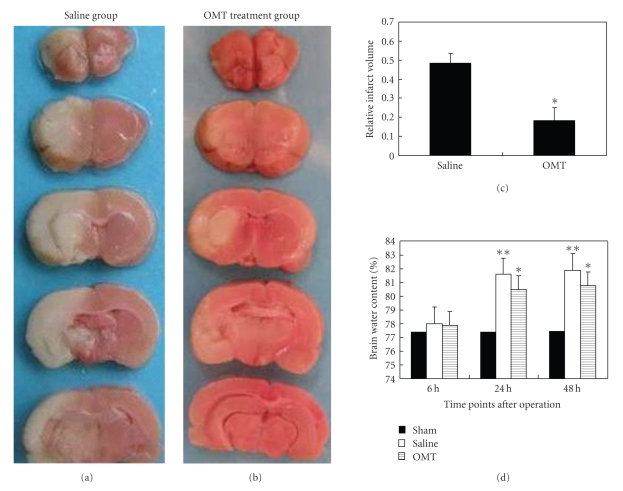
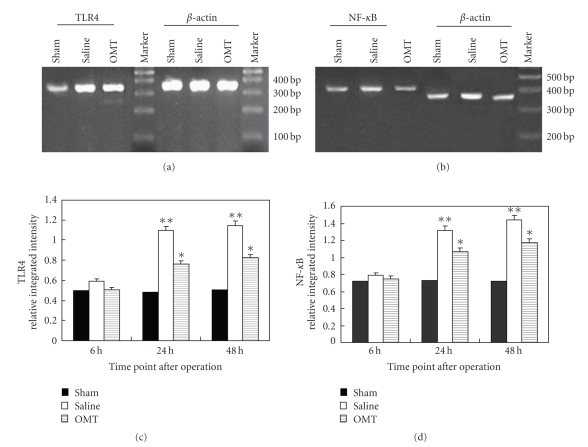
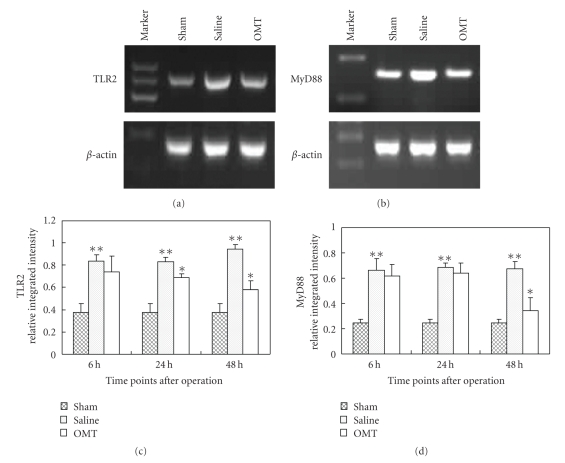
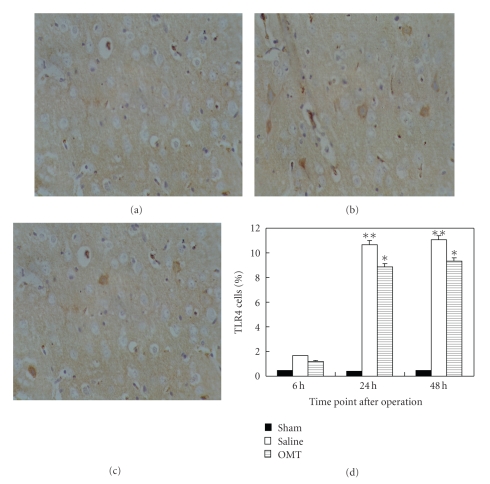
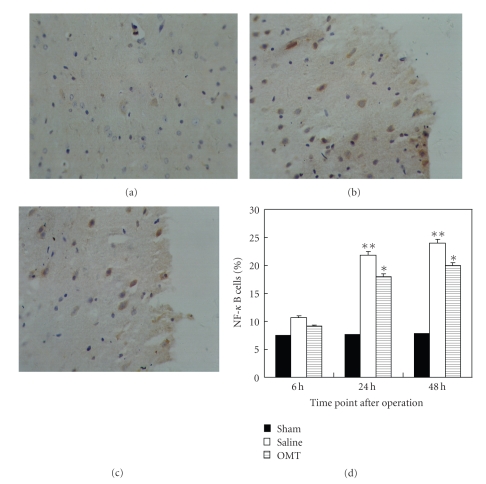
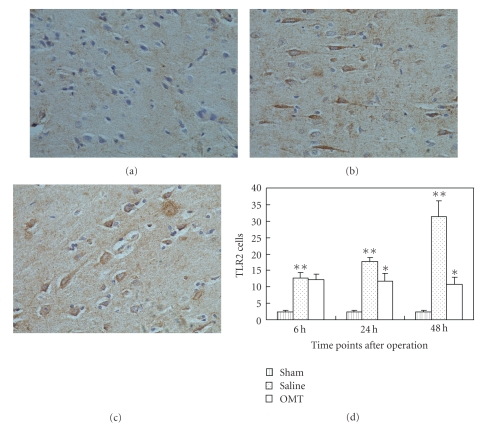
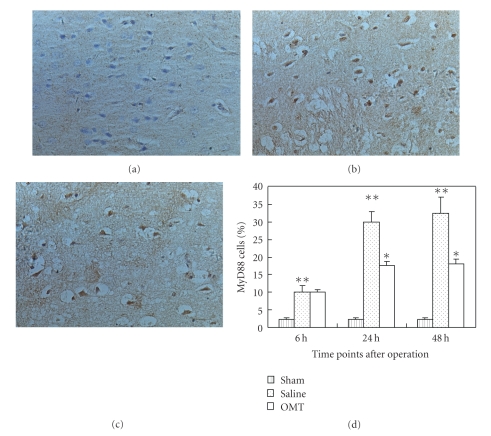
Inflammatory damage plays an important role in cerebral ischemic pathogenesis and may represent a target for treatment. Toll-like receptor-4 (TLR4), toll-like receptor-2 (TLR2), myeloid differentiation factor 88 (MyD88), and nuclear factor kappa-B (NF-kappaB) have been linked to inflammatory reactions. Our previous studies have proved that oxymatrine (OMT) protected ischemic brain injury and this effect may be through the decreasing of NF-kappaB expression. However, little is known regarding the mechanism of OMT in the acute phase of ischemic stroke. We therefore investigated the OMT's potential neuroprotective role and the underlying mechanisms. Male, Sprague-Dawley rats were randomly divided into sham, saline and OMT treatment groups. We used a middle cerebral artery occlusion (MCAO) model and administered OMT intraperitoneally immediately after cerebral ischemia and once daily on the following days. At time points after MCAO, brain water content and infarct size were measured. Immunohistochemistry and RT-PCR were used to analyse the expression of TLR4, TLR2, MyD88, and NF-kappaB at gene and protein level in ischemic brain tissue. The result indicated that OMT protected the brain from damage caused by MCAO; this effect may be through downregulation of the TLR4, TLR2, MyD88, and NF-kappaB.
Figures
References
-
- Zhang X, Li H, Hu S, et al. Brain edema after intracerebral hemorrhage in rats: the role of inflammation. Neurology India. 2006;54(4):402–407. - PubMed
-
- Li C, Ha T, Kelley J, et al. Modulating Toll-like receptor mediated signaling by (1 → 3)-β-D-glucan rapidly induces cardioprotection. Cardiovascular Research. 2004;61(3):538–547. - PubMed
-
- Akira S, Uematsu S, Takeuchi O. Pathogen recognition and innate immunity. Cell. 2006;124(4):783–801. - PubMed
-
- Fan H, Cook JA. Molecular mechanisms of endotoxin tolerance. Journal of Endotoxin Research. 2004;10(2):71–84. - PubMed
-
- Soysa NS, Alles N. NF-κB functions in osteoclasts. Biochemical and Biophysical Research Communications. 2009;378(1):1–5. - PubMed
MeSH terms
Substances
LinkOut - more resources
Full Text Sources
