

Minimally perturbing a gene regulatory network to avoid a disease phenotype: the glioma network as a test case
- PMID: 20184733
- PMCID: PMC2851584
- DOI: 10.1186/1752-0509-4-15
Minimally perturbing a gene regulatory network to avoid a disease phenotype: the glioma network as a test case
Abstract
Background: Mathematical modeling of biological networks is an essential part of Systems Biology. Developing and using such models in order to understand gene regulatory networks is a major challenge.
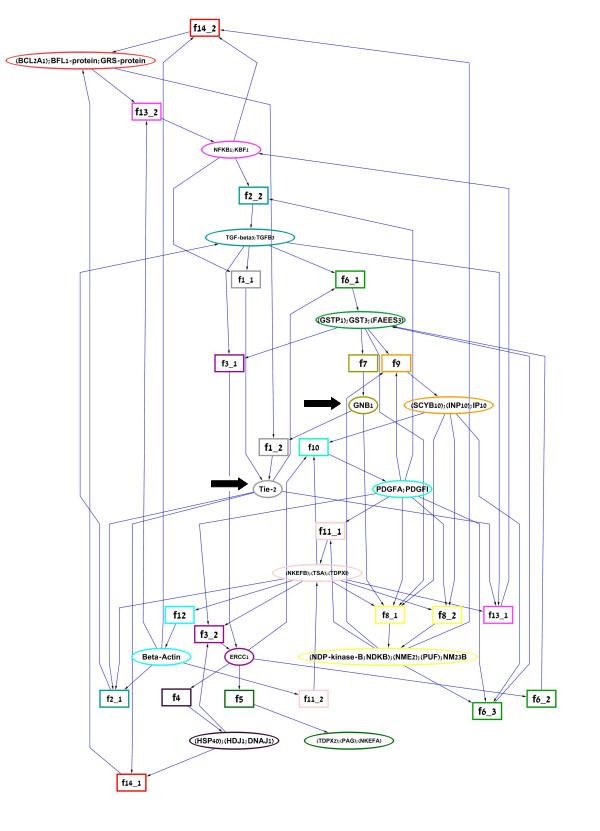
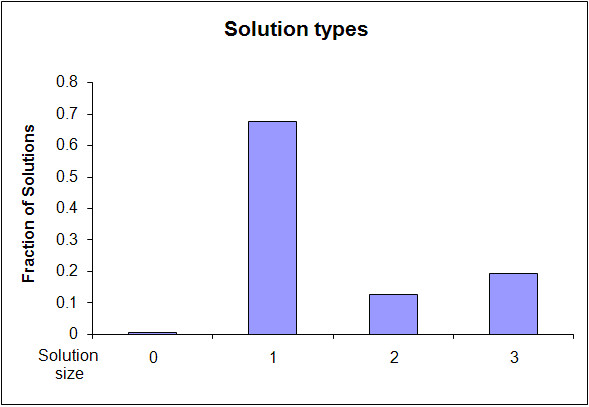
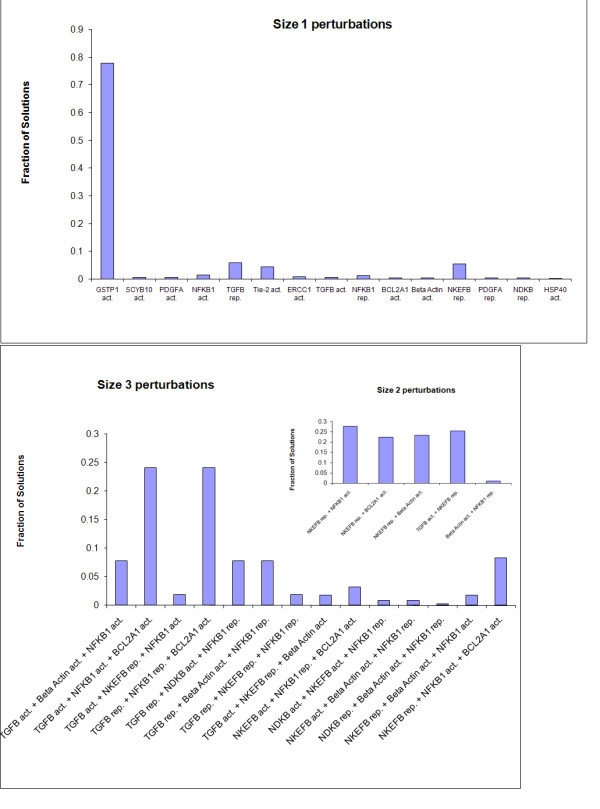
Results: We present an algorithm that determines the smallest perturbations required for manipulating the dynamics of a network formulated as a Petri net, in order to cause or avoid a specified phenotype. By modifying McMillan's unfolding algorithm, we handle partial knowledge and reduce computation cost. The methodology is demonstrated on a glioma network. Out of the single gene perturbations, activation of glutathione S-transferase P (GSTP1) gene was by far the most effective in blocking the cancer phenotype. Among pairs of perturbations, NFkB and TGF-beta had the largest joint effect, in accordance with their role in the EMT process.
Conclusion: Our method allows perturbation analysis of regulatory networks and can overcome incomplete information. It can help in identifying drug targets and in prioritizing perturbation experiments.
Figures
Similar articles
-
A composite network of conserved and tissue specific gene interactions reveals possible genetic interactions in glioma.PLoS Comput Biol. 2017 Sep 28;13(9):e1005739. doi: 10.1371/journal.pcbi.1005739. eCollection 2017 Sep. PLoS Comput Biol. 2017. PMID: 28957313 Free PMC article.
-
System analysis identifies distinct and common functional networks governed by transcription factor ASCL1, in glioma and small cell lung cancer.Mol Biosyst. 2017 Jul 25;13(8):1481-1494. doi: 10.1039/c6mb00851h. Mol Biosyst. 2017. PMID: 28742165
-
Genetic modeling of glioma formation in mice.Brain Pathol. 2002 Jan;12(1):117-32. doi: 10.1111/j.1750-3639.2002.tb00428.x. Brain Pathol. 2002. PMID: 11770894 Free PMC article. Review.
-
Simulating the impact of a molecular 'decision-process' on cellular phenotype and multicellular patterns in brain tumors.J Theor Biol. 2005 Apr 21;233(4):469-81. doi: 10.1016/j.jtbi.2004.10.019. Epub 2004 Nov 30. J Theor Biol. 2005. PMID: 15748909
-
The emerging role of miR-19 in glioma.J Cell Mol Med. 2018 Oct;22(10):4611-4616. doi: 10.1111/jcmm.13788. Epub 2018 Aug 2. J Cell Mol Med. 2018. PMID: 30073755 Free PMC article. Review.
Cited by
-
Stochastic Boolean networks: an efficient approach to modeling gene regulatory networks.BMC Syst Biol. 2012 Aug 28;6:113. doi: 10.1186/1752-0509-6-113. BMC Syst Biol. 2012. PMID: 22929591 Free PMC article.
-
HSCVFNT: Inference of Time-Delayed Gene Regulatory Network Based on Complex-Valued Flexible Neural Tree Model.Int J Mol Sci. 2018 Oct 15;19(10):3178. doi: 10.3390/ijms19103178. Int J Mol Sci. 2018. PMID: 30326663 Free PMC article.
-
Computation of Robust Minimal Intervention Sets in Multi-Valued Biological Regulatory Networks.Front Physiol. 2019 Mar 19;10:241. doi: 10.3389/fphys.2019.00241. eCollection 2019. Front Physiol. 2019. PMID: 30941053 Free PMC article.
-
Natural Small Molecules Targeting NF-κB Signaling in Glioblastoma.Front Pharmacol. 2021 Aug 27;12:703761. doi: 10.3389/fphar.2021.703761. eCollection 2021. Front Pharmacol. 2021. PMID: 34512336 Free PMC article. Review.
-
Structure and dynamics of molecular networks: a novel paradigm of drug discovery: a comprehensive review.Pharmacol Ther. 2013 Jun;138(3):333-408. doi: 10.1016/j.pharmthera.2013.01.016. Epub 2013 Feb 4. Pharmacol Ther. 2013. PMID: 23384594 Free PMC article. Review.
References
-
- Noble D. The music of life: biology beyond the genome. Oxford: Oxford University Press; 2006.
-
- Ihekwaba AE, Broomhead DS, Grimley R, Benson N, White MR, Kell DB. Synergistic control of oscillations in the NF-kappaB signalling pathway. Syst Biol. 2005;152:153–160. - PubMed
Publication types
MeSH terms
Substances
LinkOut - more resources
Full Text Sources
Medical
Research Materials
Miscellaneous
