

Measurement of intrinsic optical backscattering characteristics of cells using fiber-guided near infrared light
- PMID: 20184751
- PMCID: PMC2850905
- DOI: 10.1186/1475-925X-9-12
Measurement of intrinsic optical backscattering characteristics of cells using fiber-guided near infrared light
Abstract
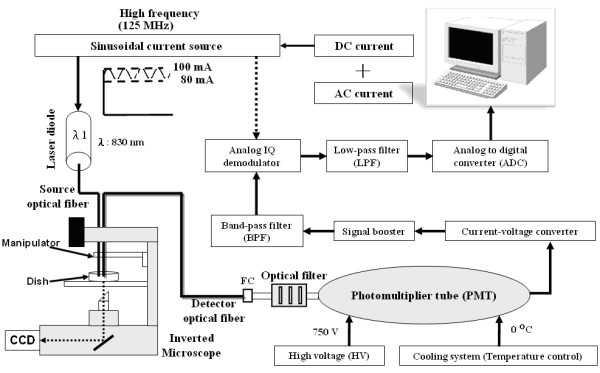
Background: Intrinsic optical signals (IOS), which reflect changes in transmittance and scattering light, have been applied to characterize the physiological conditions of target biological tissues. Backscattering approaches allow mounting of the source and detector on the same side of a sample which creates a more compact physical layout of device. This study presents a compact backscattering design using fiber-optic guided near-infrared (NIR) light to measure the amplitude and phase changes of IOS under different osmotic challenges.
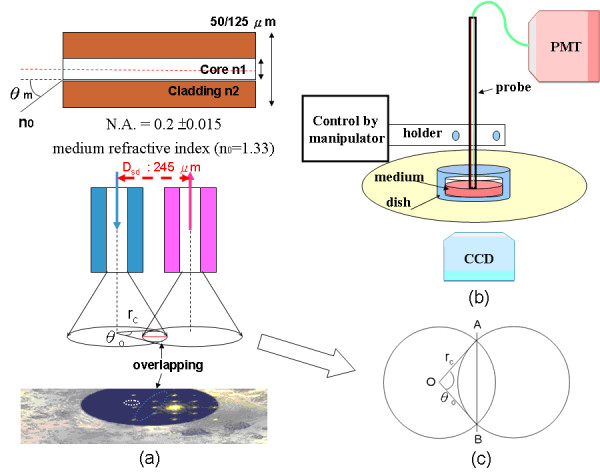
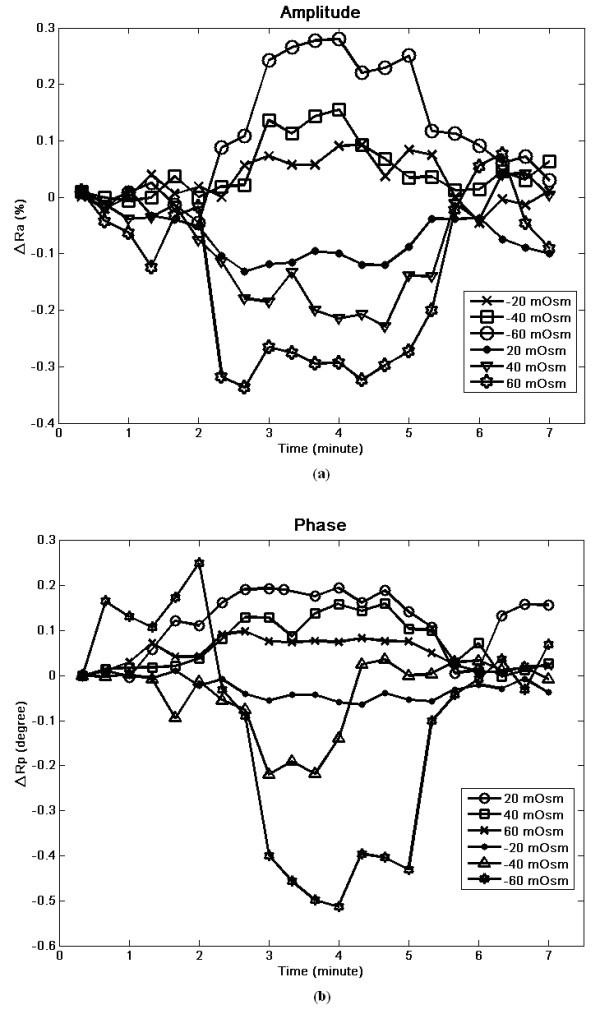
Methods: High-frequency intensity-modulated light was guided via optic fiber, which was controlled by micromanipulator to closely aim at a minimum cluster of cortical neurons. Several factors including the probe design, wavelength selection, optimal measuring distance between the fiber-optical probe and cells were considered. Our experimental setup was tested in cultured cells to observe the relationship between the changes in backscattered NIR light and cellular IOS, which is believed mainly caused by cell volume changes in hypo/hyperosmotic solutions (+/- 20, +/- 40 and +/- 60 mOsm).
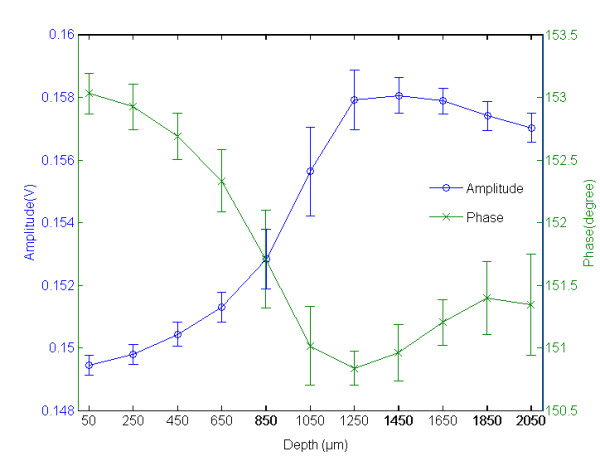
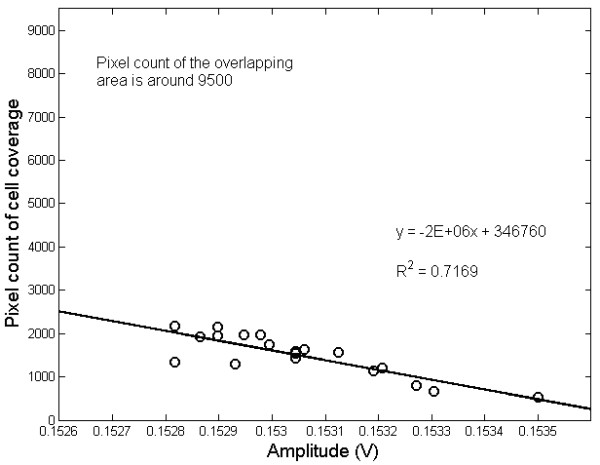
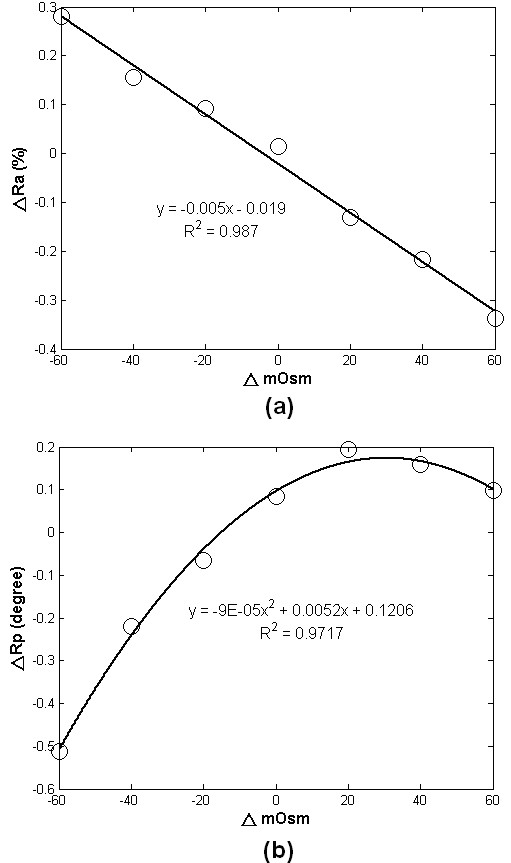
Results: The critical parameters of the current setup including the optimal measuring distance from fiber-optical probe to target tissue and the linear relationship between backscattering intensity and cell volume were determined. The backscattering intensity was found to be inversely proportional to osmotic changes. However, the phase shift exhibited a nonlinear feature and reached a plateau at hyperosmotic solution.
Conclusions: Our study indicated that the backscattering NIR light guided by fiber-optical probe makes it a potential alternative for continuous observation of intrinsic optical properties of cell culture under varied physical or chemical challenges.
Figures
Similar articles
-
A fiber optic probe design to measure depth-limited optical properties in-vivo with low-coherence enhanced backscattering (LEBS) spectroscopy.Opt Express. 2012 Aug 27;20(18):19643-57. doi: 10.1364/OE.20.019643. Opt Express. 2012. PMID: 23037017 Free PMC article.
-
Light scattering in brain slices measured with a photon counting fiber optic system.J Neurosci Methods. 2000 Aug 15;101(1):19-29. doi: 10.1016/s0165-0270(00)00251-x. J Neurosci Methods. 2000. PMID: 10967358
-
Assessing the contribution of cell body and intracellular organelles to the backward light scattering.Opt Express. 2012 Jan 16;20(2):816-26. doi: 10.1364/OE.20.000816. Opt Express. 2012. PMID: 22274427 Free PMC article.
-
Short wavelength infrared frequency conversion in ultra-compact fiber device.Opt Express. 2010 Jan 18;18(2):439-45. doi: 10.1364/OE.18.000439. Opt Express. 2010. PMID: 20173863
-
MiniRead: A simple and inexpensive do-it-yourself device for multiple analyses of micro-organism growth kinetics.Yeast. 2024 May;41(5):307-314. doi: 10.1002/yea.3932. Epub 2024 Feb 21. Yeast. 2024. PMID: 38380872 Review.
References
-
- Chance B, Cope M, Gratton E, Ramanujam N, Tromberg B. Phase measurement of light absorption and scatter in human tissue. Rev Sci Instrum. 1998;69:3457–3481. doi: 10.1063/1.1149123. - DOI
-
- Lin PY, Lin SI, Penney T, Chen JJJ. Review: applications of near infrared spectroscopy and imaging for motor rehabilitation in stroke patients. J Med Biol Eng. 2009;29:210–211.
-
- Cerussi AE, Tromberg BJ. Biomedical Photonics Handbook. Chap 22. Boca Raton FL, CRC Press LLC; 2003. Photon migration spectroscopy frequency-domain techniques.
Publication types
MeSH terms
LinkOut - more resources
Full Text Sources
Other Literature Sources
Miscellaneous
