

SplicerAV: a tool for mining microarray expression data for changes in RNA processing
- PMID: 20184770
- PMCID: PMC2838864
- DOI: 10.1186/1471-2105-11-108
SplicerAV: a tool for mining microarray expression data for changes in RNA processing
Abstract
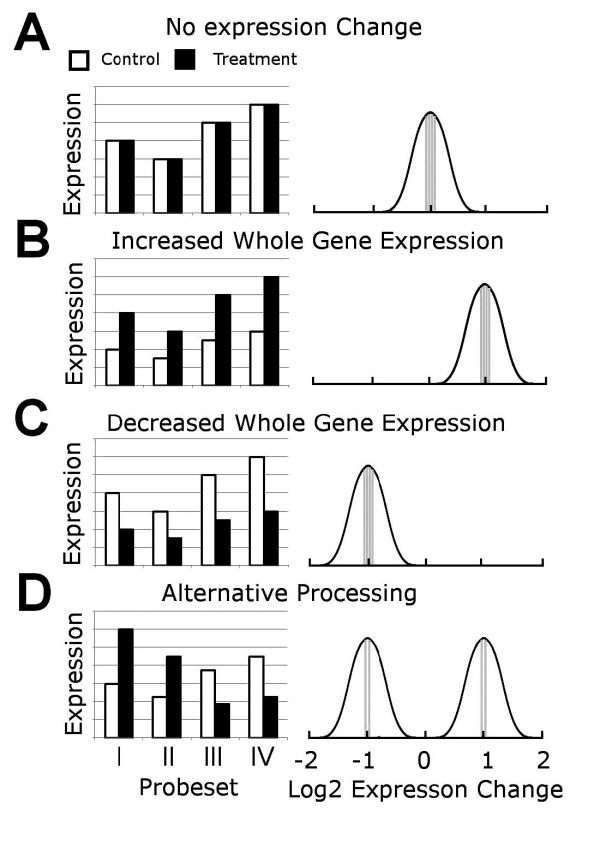
Background: Over the past two decades more than fifty thousand unique clinical and biological samples have been assayed using the Affymetrix HG-U133 and HG-U95 GeneChip microarray platforms. This substantial repository has been used extensively to characterize changes in gene expression between biological samples, but has not been previously mined en masse for changes in mRNA processing. We explored the possibility of using HG-U133 microarray data to identify changes in alternative mRNA processing in several available archival datasets.
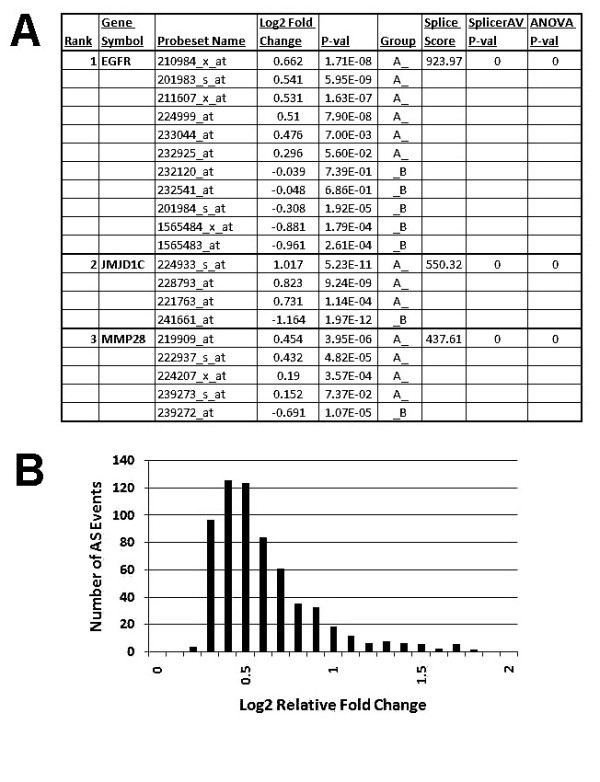
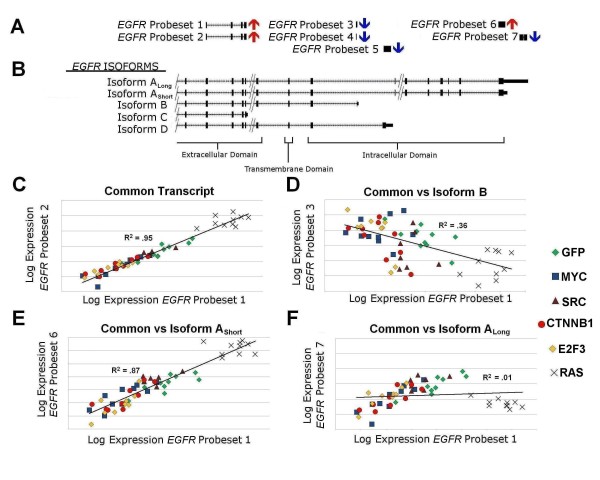
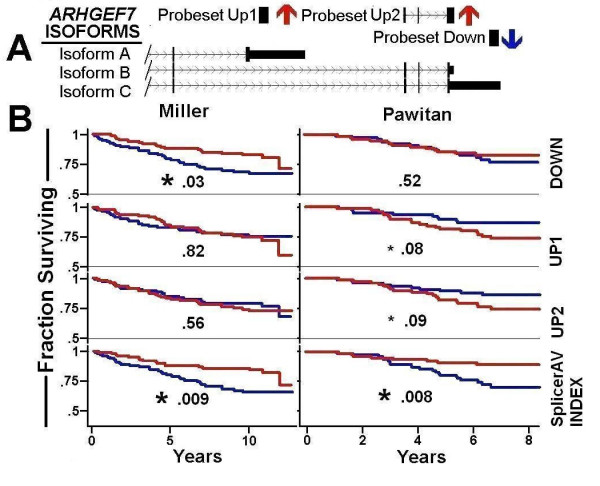
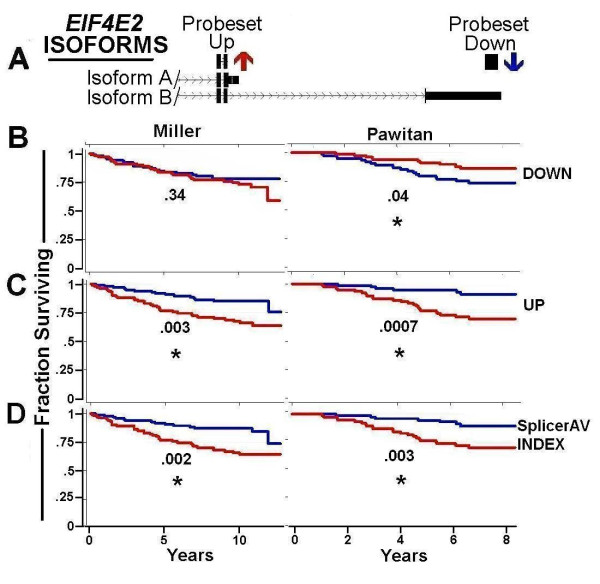
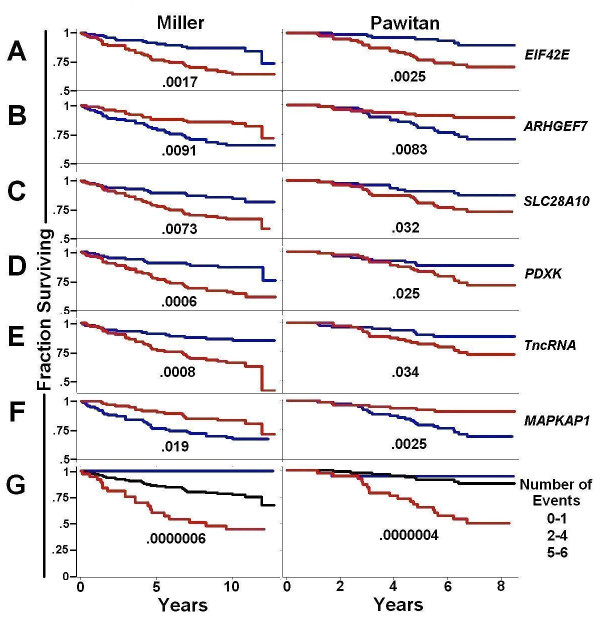
Results: Data from these and other gene expression microarrays can now be mined for changes in transcript isoform abundance using a program described here, SplicerAV. Using in vivo and in vitro breast cancer microarray datasets, SplicerAV was able to perform both gene and isoform specific expression profiling within the same microarray dataset. Our reanalysis of Affymetrix U133 plus 2.0 data generated by in vitro over-expression of HRAS, E2F3, beta-catenin (CTNNB1), SRC, and MYC identified several hundred oncogene-induced mRNA isoform changes, one of which recognized a previously unknown mechanism of EGFR family activation. Using clinical data, SplicerAV predicted 241 isoform changes between low and high grade breast tumors; with changes enriched among genes coding for guanyl-nucleotide exchange factors, metalloprotease inhibitors, and mRNA processing factors. Isoform changes in 15 genes were associated with aggressive cancer across the three breast cancer datasets.
Conclusions: Using SplicerAV, we identified several hundred previously uncharacterized isoform changes induced by in vitro oncogene over-expression and revealed a previously unknown mechanism of EGFR activation in human mammary epithelial cells. We analyzed Affymetrix GeneChip data from over 400 human breast tumors in three independent studies, making this the largest clinical dataset analyzed for en masse changes in alternative mRNA processing. The capacity to detect RNA isoform changes in archival microarray data using SplicerAV allowed us to carry out the first analysis of isoform specific mRNA changes directly associated with cancer survival.
Figures
Similar articles
-
Gene expression and isoform variation analysis using Affymetrix Exon Arrays.BMC Genomics. 2008 Nov 7;9:529. doi: 10.1186/1471-2164-9-529. BMC Genomics. 2008. PMID: 18990248 Free PMC article.
-
The effect of oligonucleotide microarray data pre-processing on the analysis of patient-cohort studies.BMC Bioinformatics. 2006 Mar 2;7:105. doi: 10.1186/1471-2105-7-105. BMC Bioinformatics. 2006. PMID: 16512908 Free PMC article.
-
SplicerEX: a tool for the automated detection and classification of mRNA changes from conventional and splice-sensitive microarray expression data.RNA. 2012 Aug;18(8):1435-45. doi: 10.1261/rna.033621.112. Epub 2012 Jun 26. RNA. 2012. PMID: 22736799 Free PMC article.
-
Clinical uses of microarrays in cancer research.Methods Mol Med. 2008;141:87-113. doi: 10.1007/978-1-60327-148-6_6. Methods Mol Med. 2008. PMID: 18453086 Free PMC article. Review.
-
Detection call algorithms for high-throughput gene expression microarray data.Brief Bioinform. 2010 Mar;11(2):244-52. doi: 10.1093/bib/bbp055. Epub 2009 Nov 25. Brief Bioinform. 2010. PMID: 19939941 Free PMC article. Review.
Cited by
-
Sources of high variance between probe signals in Affymetrix short oligonucleotide microarrays.Sensors (Basel). 2013 Dec 31;14(1):532-48. doi: 10.3390/s140100532. Sensors (Basel). 2013. PMID: 24385030 Free PMC article.
-
Enhanced information output from shotgun proteomics data by protein quantification and peptide quality control (PQPQ).Mol Cell Proteomics. 2011 Oct;10(10):M111.010264. doi: 10.1074/mcp.M111.010264. Epub 2011 Jul 6. Mol Cell Proteomics. 2011. PMID: 21734112 Free PMC article.
-
Unique Transcriptional Programs Identify Subtypes of AKI.J Am Soc Nephrol. 2017 Jun;28(6):1729-1740. doi: 10.1681/ASN.2016090974. Epub 2016 Dec 27. J Am Soc Nephrol. 2017. PMID: 28028135 Free PMC article.
-
Inhibition of Epidermal Growth Factor Receptor Signaling by Antisense Oligonucleotides as a Novel Approach to Epidermal Growth Factor Receptor Inhibition.Nucleic Acid Ther. 2022 Oct;32(5):391-400. doi: 10.1089/nat.2021.0101. Epub 2022 Jul 20. Nucleic Acid Ther. 2022. PMID: 35861718 Free PMC article.
-
Epstein-Barr virus induces global changes in cellular mRNA isoform usage that are important for the maintenance of latency.J Virol. 2013 Nov;87(22):12291-301. doi: 10.1128/JVI.02464-13. Epub 2013 Sep 11. J Virol. 2013. PMID: 24027308 Free PMC article.
References
Publication types
MeSH terms
Substances
Grants and funding
LinkOut - more resources
Full Text Sources
Other Literature Sources
Research Materials
Miscellaneous
