

Fatal traffic crashes involving drinking drivers: what have we learned?
- PMID: 20184833
- PMCID: PMC3256806
Fatal traffic crashes involving drinking drivers: what have we learned?
Abstract
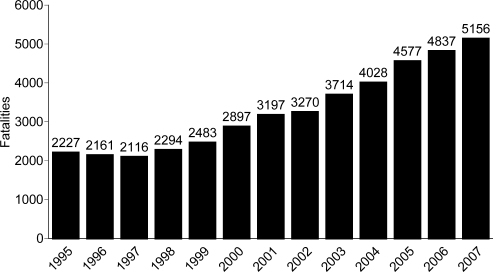
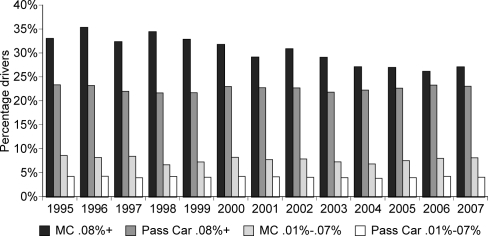
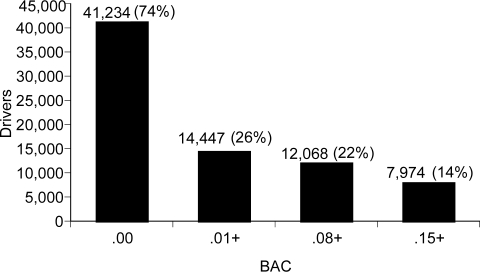
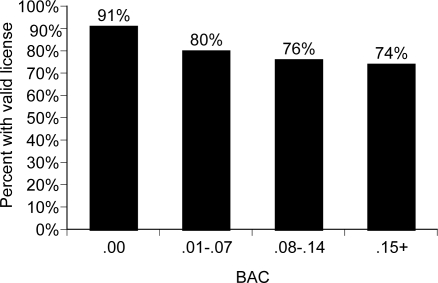
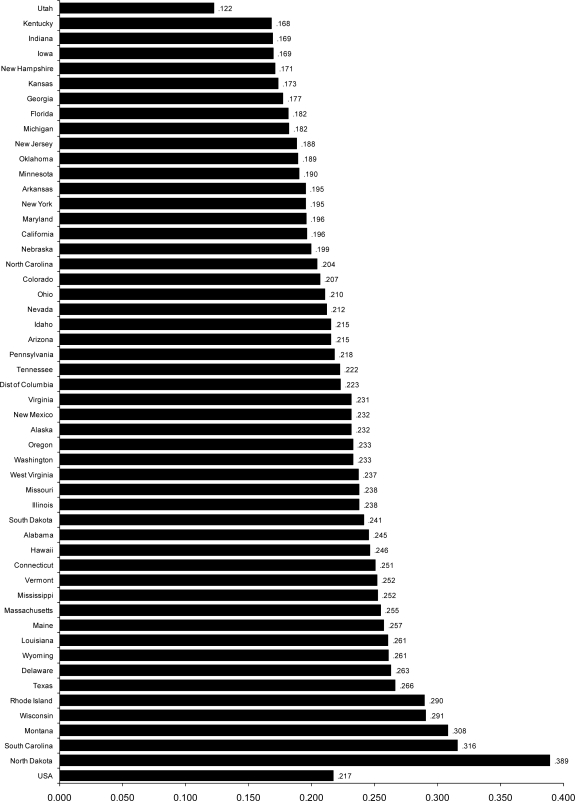
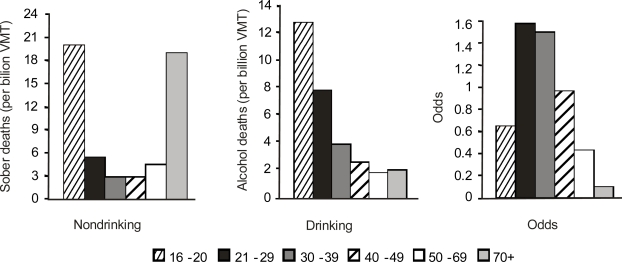
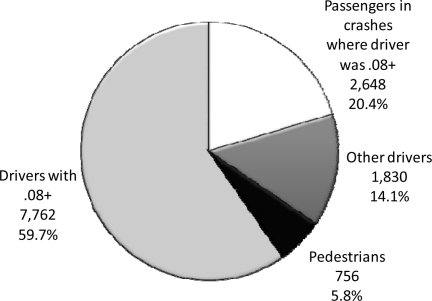
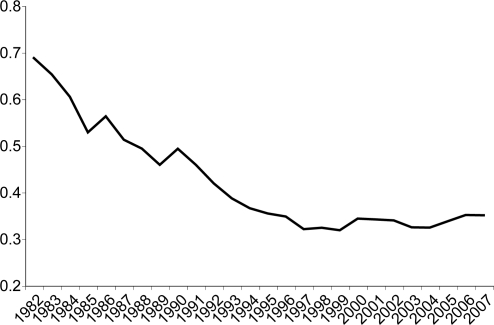
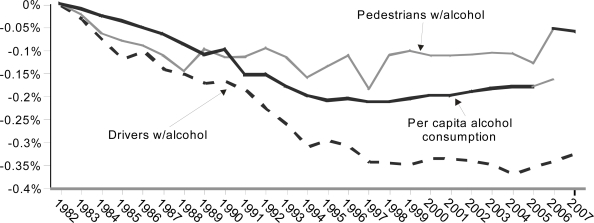
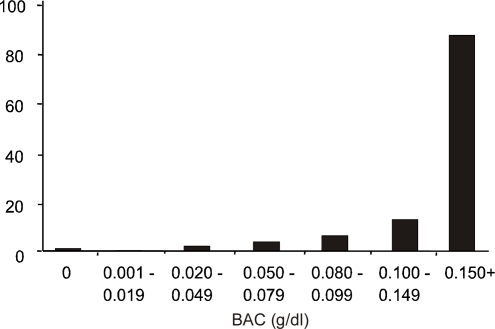
Alcohol involvement in fatal crashes (any driver with a blood alcohol concentration [BAC] = .01g/dL or greater) in 2007 was more than three times higher at night (6 p.m.-6 a.m.) than during the day (6 a.m.-6 p.m.) (62% versus 19%). Alcohol involvement was 35% during weekdays compared to 54% on weekends. Nearly one in four drivers (23%) of personal vehicles (e.g., passenger cars or light trucks) and more than one in four motorcyclists (27%) in fatal crashes were intoxicated (i.e., had a BAC equal to or greater than the .08 g/dL illegal limit in the United States). In contrast, only 1% of the commercial drivers of heavy trucks had BACs equal to .08 g/dL or higher. More than a quarter (26%) of the drivers with high BACs (>or=.15 g/dL) did not have valid licenses. The 21- to 24-age group had the highest proportion (35%) of drivers with BACs>or=.08 g/dL, followed by the 25- to 34-age group (29%). The oldest and the youngest drivers had the lowest percentages of BACs>or= .08 g/dL: those aged 75 or older were at 4%, and those aged 16 to 20 were at 17%. Utah had the lowest rate of intoxicated drivers in fatal crashes at one in every eight drivers (12%), followed by Kentucky, Indiana, Iowa, New Hampshire, and Kansas, all at 17%. Montana (31%), South Carolina (31%), and North Dakota (39%) all had more than 3 in 10 drivers in fatal crashes who were intoxicated in 2007. The United States enjoyed a remarkable downward trend in alcohol-related crashes between 1982 and 1995, which has since leveled off. That trend coincided with a period during which per capita national alcohol consumption declined, the number of young drivers decreased, and the proportion of female drivers increased. Those factors alone, however, did not appear to account for the overall reduction. This provides further evidence that impaired-driving laws and safety program activity may have been responsible for at least some of the decline. However, there was a general worldwide decline in alcohol-related crashes during the same period, and other socioeconomic factors may have played a role. Proven effective strategies that could reduce impaired driving further in the United States include more frequent highly publicized enforcement efforts, such as sobriety checkpoints; lowering the illegal BAC limit for driving to .05g/dL; and mandating alcohol ignition interlocks for all convicted impaired drivers.
Figures
Similar articles
-
Effects of enforcement intensity on alcohol impaired driving crashes.Accid Anal Prev. 2014 Dec;73:181-6. doi: 10.1016/j.aap.2014.09.002. Epub 2014 Sep 18. Accid Anal Prev. 2014. PMID: 25240134 Free PMC article.
-
State alcohol ignition interlock laws and fatal crashes.Traffic Inj Prev. 2021;22(8):589-592. doi: 10.1080/15389588.2021.1984439. Epub 2021 Oct 22. Traffic Inj Prev. 2021. PMID: 34686075
-
The relationship of 16 underage drinking laws to reductions in underage drinking drivers in fatal crashes in the United States.Annu Proc Assoc Adv Automot Med. 2007;51:537-57. Annu Proc Assoc Adv Automot Med. 2007. PMID: 18184512 Free PMC article.
-
International policies on alcohol impaired driving: are legal blood alcohol concentration (BAC) limits in motorized countries compatible with the scientific evidence?Nihon Arukoru Yakubutsu Igakkai Zasshi. 2003 Apr;38(2):83-102. Nihon Arukoru Yakubutsu Igakkai Zasshi. 2003. PMID: 12784660 Review.
-
The effectiveness of reducing illegal blood alcohol concentration (BAC) limits for driving: evidence for lowering the limit to .05 BAC.J Safety Res. 2006;37(3):233-43. doi: 10.1016/j.jsr.2005.07.006. Epub 2006 Jul 7. J Safety Res. 2006. PMID: 16824545 Review.
Cited by
-
The Prevalence of Alcohol in Road Traffic Accidents Fatalities in Central Serbia.Iran J Public Health. 2022 Aug;51(8):1906-1908. doi: 10.18502/ijph.v51i8.10281. Iran J Public Health. 2022. PMID: 36249101 Free PMC article. No abstract available.
-
Impact of an enhanced sobriety checkpoints programme and publicity campaign on motor vehicle collisions, injuries and deaths in Leon, MX: a synthetic control study.Inj Prev. 2024 Jul 22:ip-2023-045019. doi: 10.1136/ip-2023-045019. Online ahead of print. Inj Prev. 2024. PMID: 39038940 Free PMC article.
-
Can progress in reducing alcohol-impaired driving fatalities be resumed? Results of a workshop sponsored by the Transportation Research Board, Alcohol, Other Drugs, and Transportation Committee (ANB50).Traffic Inj Prev. 2016 Nov 16;17(8):771-81. doi: 10.1080/15389588.2016.1157592. Epub 2016 Mar 15. Traffic Inj Prev. 2016. PMID: 26980557 Free PMC article.
-
Determinants for Drunk Driving Recidivism-An Application of the Integrated Prototype Willingness Model.Behav Sci (Basel). 2025 Jan 5;15(1):48. doi: 10.3390/bs15010048. Behav Sci (Basel). 2025. PMID: 39851852 Free PMC article.
-
Evaluating Surveillance for Excessive Alcohol Use in New Mexico.Prev Chronic Dis. 2018 Dec 20;15:E161. doi: 10.5888/pcd15.180358. Prev Chronic Dis. 2018. PMID: 30576273 Free PMC article.
References
-
- Allsop RE. Alcohol and Road Accidents (Road Research Laboratory Report No. 6) Harmondsworth, England: Road Research Laboratory, Ministry of Transport; 1966.
-
- Blincoe LJ, Seay A, Zaloshnja E, et al. The economic impact of motor vehicle crashes, 2000 (DOT HS 809 446) Washington, DC: U.S. Department of Transportation, National Highway Traffic Safety Administration; May, 2002.
-
- Blomberg RD, Peck RC, Moskowitz H, et al. Crash risk of alcohol involved driving: A case-control study. Stanford, CT: Dunlap & Associates, Inc.; 2005.
-
- Borkenstein RF, Crowther RF, Shumante RP, et al. The role of the drinking driver in traffic accidents. Bloomington, IN: Department of Police Administration, Indiana University; 1964.
-
- Borkenstein RF, Crowther RF, Shumate RP, et al. The role of the drinking driver in traffic accidents. Blutalkohol. 1974;11(Supplement 1):1–132.
MeSH terms
LinkOut - more resources
Full Text Sources
Medical