. 2010 Apr 15;340(2):613-25.
doi: 10.1016/j.ydbio.2010.02.021. Epub 2010 Feb 23.

Neural crest cell-specific deletion of Rac1 results in defective cell-matrix interactions and severe craniofacial and cardiovascular malformations

Affiliations

Neural crest cell-specific deletion of Rac1 results in defective cell-matrix interactions and severe craniofacial and cardiovascular malformations

Penny S Thomas et al. Dev Biol. .

Abstract

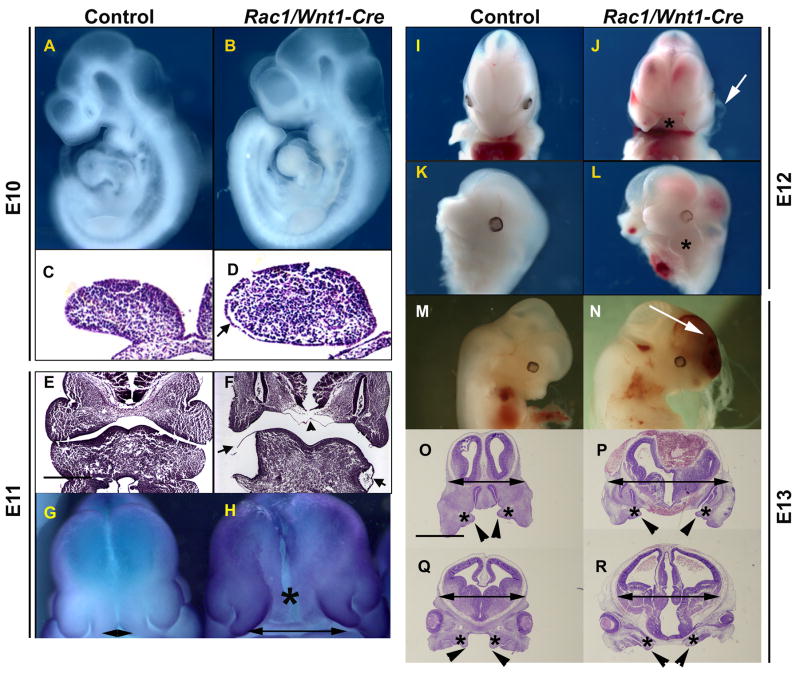
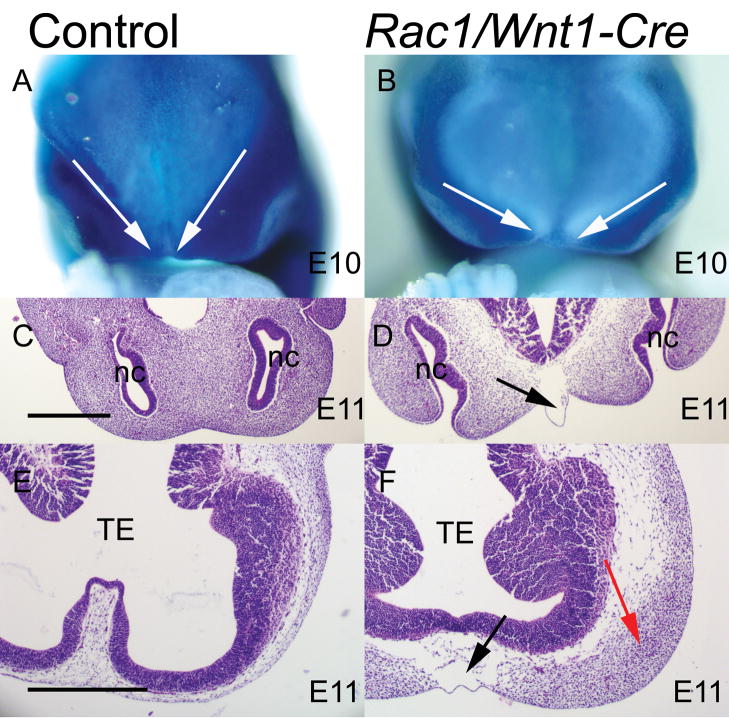
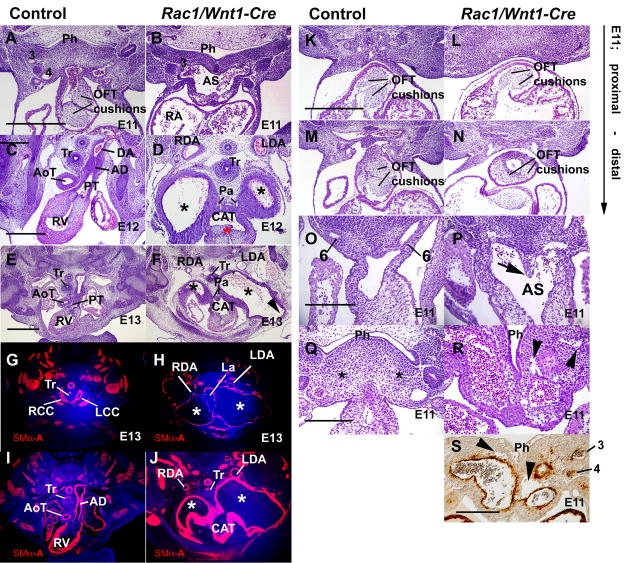
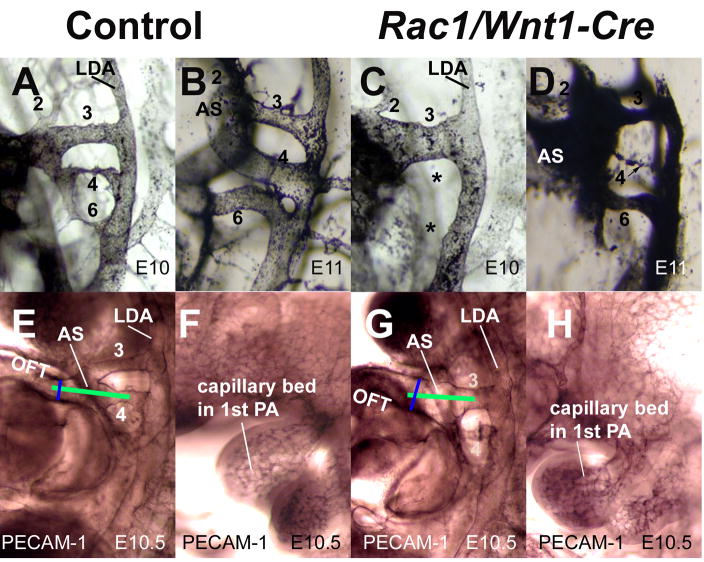
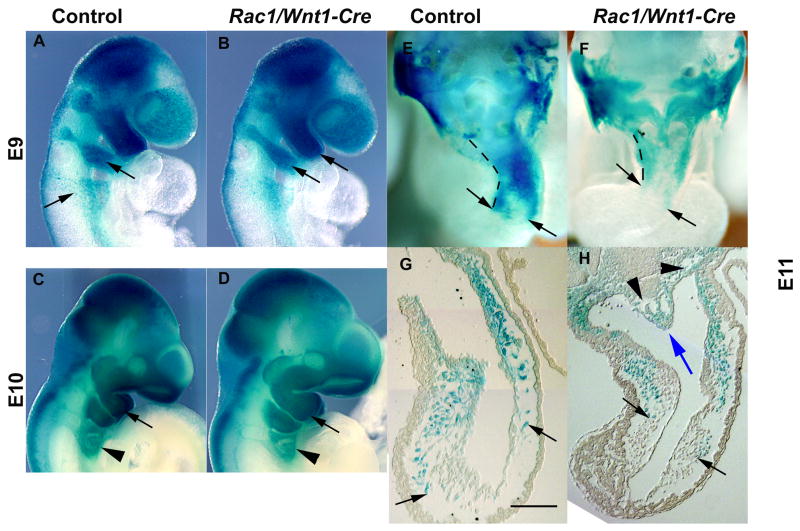
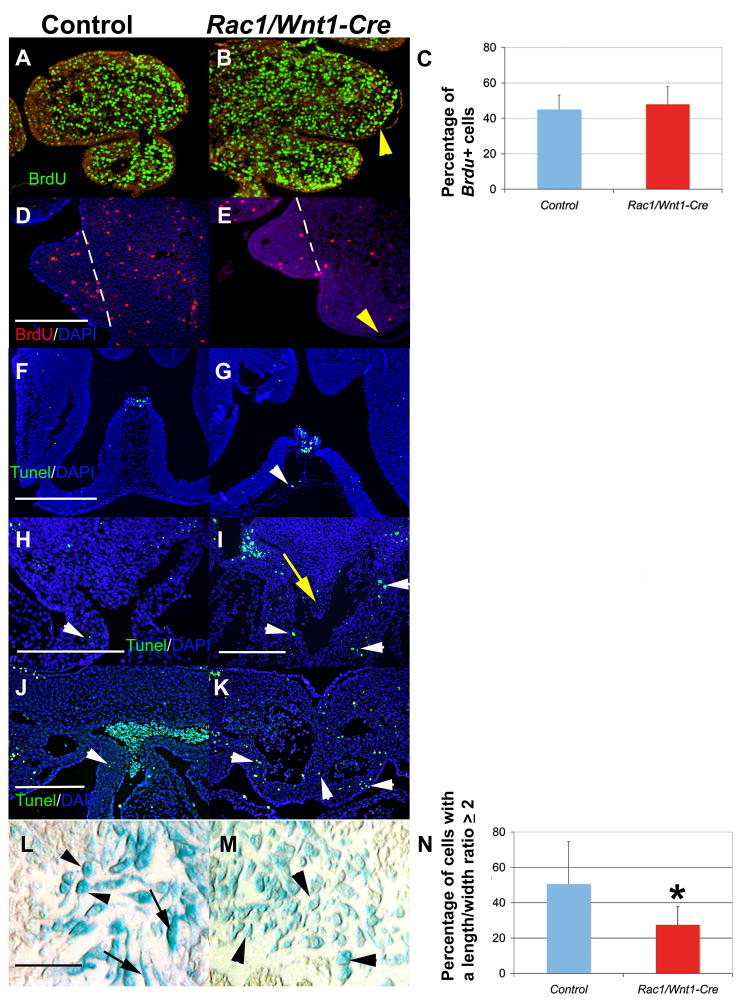
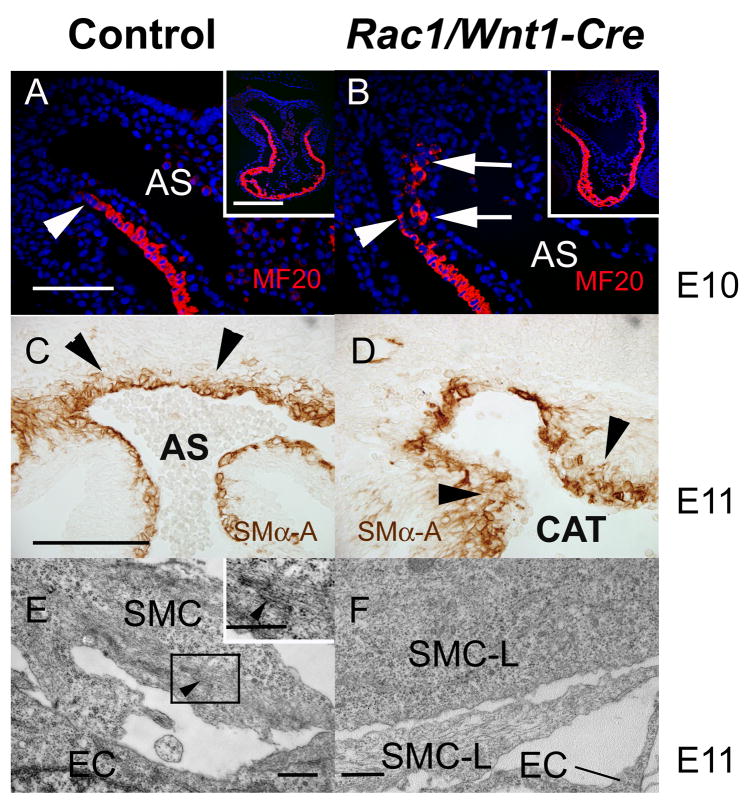
The small GTP-binding protein Rac1, a member of the Rho family of small GTPases, has been implicated in regulation of many cellular processes including adhesion, migration and cytokinesis. These functions have largely been attributed to its ability to reorganize cytoskeleton. While the function of Rac1 is relatively well known in vitro, its role in vivo has been poorly understood. It has previously been shown that in neural crest cells (NCCs) Rac1 is required in a stage-specific manner to acquire responsiveness to mitogenic EGF signals. Here we demonstrate that mouse embryos lacking Rac1 in neural crest cells (Rac1/Wnt1-Cre) showed abnormal craniofacial development including regional ectodermal detachment associated with mesenchymal acellularity culminating in cleft face at E12. Rac1/Wnt1-Cre mutants also displayed inappropriate remodelling of pharyngeal arch arteries and defective outflow tract septation resulting in the formation of a common arterial trunk ('persistent truncus arteriosus' or PTA). The mesenchyme around the aortic sac also developed acellular regions, and the distal aortic sac became grossly dysmorphic, forming a pair of bilateral, highly dilated arterial structures connecting to the dorsal aortas. Smooth muscle cells lacking Rac1 failed to differentiate appropriately, and subpopulations of post-migratory NCCs demonstrated aberrant cell death and attenuated proliferation. These novel data demonstrate that while Rac1 is not required for normal NCC migration in vivo, it plays a critical cell-autonomous role in post-migratory NCCs during craniofacial and cardiac development by regulating the integrity of the craniofacial and pharyngeal mesenchyme.


Figures

Fig. 1
Fig. 1. Craniofacial defects in Rac1/Wnt1-Cre mutant embryos
At E10, the Rac1/Wnt1-Cre conditional knockout embryo (B) appears superficially unaffected when compared to control (A); however, histological sections show epithelial detachment from the underlying mesenchyme in mutant mandibular arch (arrow in D). At E11 (E–F), mutant embryos have large superficial blisters on mandibular arches (arrows in F). The mutant (H) heads are generally broader than those of controls (G) with a wide separation between the medial nasal processes (double-headed arrows; G, H; in situ hybridization for Axin-2). Epithelial detachment can also be seen in the midline region between the two nasal processes (F; arrowhead) corresponding to the position marked by an asterisk in H. At E12, the Rac1/Wnt1-Cre mutant embryo has a severe mid-facial cleft (J; asterisk) and rudimentary maxillary processes (L; asterisk). Arrow in J points to an epithelial blister in the first pharyngeal arch. At E13, a mutant (N) shows facial and cranial hemorrhaging (arrow) when compared to a control littermate (M). Histological sections at the level of nasal cavities (O, P) and at eye level (Q, R) show that at E13 the posteror palatal shelves (arrow heads) are much smaller in mutants (R) than in controls (Q) and overall amount of the craniofacial mesenchyme (asterisks in O, P, Q and R) in mutants is reduced. Scale bars indicate 500μm: F as E; P–R as O.
Fig. 2
Fig. 2. Early distribution of neural crest-derived craniofacial mesenchyme in Rac1/Wnt1-Cre mutants
R26R fate determination assay of control (A) and mutant (B) samples at E10. The neural crest (NC)-derived mesenchyme has been visualized by β-galactosidase staining (blue cells in A and B). White arrows in A and B illustrate the more medial NC boundaries in control (A) than mutant (B). Horizontal sections of control (C, E) and Rac1/Wnt1-Cre mutants (D, F) show an acellular subepithelial region in the midline at E11 in mutants (black arrows in D and F). A lateral accumulation of mesenchymal cells adjacent to the telencephalon can be seen in Rac1/Wnt1-Cre mutants (red arrow in F), but not in controls (E). TE, telencephalon; nc, nasal cavity. Scale bars indicate 500μm: D as C; F as E.
Fig. 3
Fig. 3. Pharyngeal arterial and cardiac outflow tract defects in Rac1/Wnt1-Cre mutants
A–J; At E11, Outflow tract (OFT) and aortico-pulmonary (AP) septation are in progress and an OFT with well-developed cushions leads to discrete anterior/posteriorly arranged trunk precursors in control (A,) but in mutant (B) a much broader common vessel extends from aortic sac to third pharyngeal arch artery (PAA3). At E12, discrete aortic (AoT) and pulmonary (PT) trunks indicate normal AP septation has occurred in control (C). Only PT connects to pulmonary arteries (below the plane of sectioning) and to the top of the descending aorta (DA) via the arterial duct (AD). In mutant (D) a single three leaflet valve (red asterisk) leads to a large, common arterial trunk (CAT) indicating failure of AP septation, and connects both to pulmonary arteries (Pa) and two dramatically dilated bilateral vessels (*) each of which eventually makes a sole connection to a normal-sized dorsal aorta (left dorsal aorta, LDA; right dorsal aorta, RDA). At E13, the same structures and differences are present in control (E,G,I) and mutant (F,H,J). Smooth muscle α-actin (SMα-A)-positive cells shown in red, nuclei in blue. The mature pattern of great arteries is present in control (G) including right (RCC) and left common carotid (LCC) arteries. In mutant (F,H,J) the abnormal arterial vessels (*) leading from the common trunk are even more dilated, pressing against dense medial mesenchyme around the trachea (Tr) and laryngeal (La) structures and partially interrupting the neck wall (F: arrowhead). They empty only into relatively tiny dorsal aortas (H: LDA, RDA). A high proportion of the abnormal vessel walls contains SM-αA-positive cells, even though the surface area is hundreds of times greater than that of the control arteries. K–P: At E11, the proximal parts of the two OFT cushions are distinct and similarly oriented in both control (K) and mutant (L) embryos. More distally the neural crest (NC)-derived OFT cushions lacking Rac1 appear fused, smaller and abnormally positioned on the posterior side of the OFT (N) compared to corresponding control cushions (M), creating a single off-center flow route. While AP septation has occurred in the control sample (O; the AP septum is not a separate structure any more), the mutant sample displays a NC-derived AP-septum-like structure (P; arrow; see also Fig. 5H). Q–S: Mutant pharyngeal mesenchyme contains abnormal irregular cavities (arrowheads in R and S) that are not visible in comparable area of control (Q, asterisk). Cells surrounding these cavities do not stain positive for SMα-A (S). 3, 4, 6: 3rd, 4th, 6th pharyngeal arch arteries respectively; Ph, pharynx. Scale bars indicate either 500μm (B as A; D as C; F–J as G; L–N as K); or 250μm (P as O; R as Q; S).
Fig. 4
Fig. 4. Abnormal patterning of pharyngeal arch arteries in Rac1/Wnt1-Cre mutants
Left lateral view after intracardiac ink injection of pharyngeal arch arteries (PAAs) in controls (A,B) and mutants (C,D) at E10 (A,C) and E11 (B, D). All three PAAs; (3,4,6) are detectable in control samples (A, B), while in the mutant sample at E10 only a prominent 3rd PAA can be seen. At E11, the mutant displays a prominent 3rd PAA and relatively normal-looking 6th PAA, while the narrow 4th PAA lumen is not completely patent (D). Whole-mount immunostaining for CD31 (PECAM1) at E10.5 showed a wider, abnormally aligned aortic sac in mutant (G) when compared to control (E). Green lines illustrate a difference in alignment between control (E) and mutant (G). Blue lines illustrate diameter of distal OFT. The vascular bed of the first pharyngeal arch in the mutant (H) was similar to that of the control (F) at E10.
Fig. 5
Fig. 5. Neural crest cells deficient in Rac1 migrate normally in vivo
Lineage tracing of migrating neural crest cells (NCCs) using wholemount R26R fate determination assay at E9 (A, B), E10 (C, D) and E11 (E–H). A–D: External lateral views of control (A, C) and mutant embryos (B, D) show identical staining patterns, including at the level of pharyngeal arches 4–6 (arrowheads); E–F: wholemount embryos dissected transversely at the outflow tract (OFT) level, and sections, demonstrating cardiac NCC migration into the OFT has occurred to the same morphological position in control (E,G) and mutant (F,H) embryos (black arrows point to most proximally migrated positively staining (blue) NC-derived cells; blue arrow points to an aortico-pulmonary septum-like structure containing blue NCCs; black arrowheads point to aberrant mesenchymal cavities). Hatched lines depict the length of the OFT (E, F). Scale bar indicates 100μm (H as G).
Fig. 6
Fig. 6. Wnt1-Cre-induced recombination of Rac1 impairs neural crest cell spreading on 2D matrices
Rac1-deficient neural crest (NC)-derived pharyngeal arch mesenchymal cell cultures (B, D, F, H, J) showed reduced spreading, aberrant clumping (B), elongated phenotype and reduced number of focal adhesion complexes on fibronectin when compared to corresponding control cultures (A, C, E, G, I). A,B, R26R fate determination assay, arrows point to positively stained NC-derived cells; C–D, phalloidin staining, arrows point to actin stress fibers; G,H, immunostaining for Fak, white arrowheads point to positively staining focal adhesion complexes; E,F, I,J, immunostaining for β-galactosidase. After serum starvation, most of the Rac1-deficient cells showed a rounded phenotype (L; arrows point to rounded cells) when compared to corresponding control cells (K; arrows point to well-spread cells). Growth factor stimulation with epidermal growth factor (EGF; 100 ng/ml) and basic FGF (bFGF; 100 ng/ml) induced moderate cell spreading in mutants (arrows in N), although sill remains less than in that in corresponding controls (M; arrows point to spread cells). Bar chart (O) shows quantification of changes in cell spreading after stimulation with EGF and bFGF (100ng/ml each). Based on the diameter of an unspread cell (x), cells were divided into three groups: no spreading (blue column), modest spreading: >x to 2x (red column); extensive spreading: > 2x (green column) and the percentage of cells in each group calculated. More than 200 cells were scored in each group. Scale bars indicate either 100μm (A,B; G as I; J as H; L,M,N as K) or 25μm (C as E; D as F).
Fig. 7
Fig. 7. Effect of Rac1 inactivation in neural crest cells on cell proliferation, apoptosis and cellular morphology in vivo
A–C, BrdU incorporation assay to assess mesenchymal cell proliferation in the first and second pharyngeal arches at E10. BrdU-labelled nuclei green, counterstain red (A, control; B, mutant). Bar chart in C shows the quantification as a percentage of BrdU-positive cells; blue column, control; red column, Rac1/Wnt1-Cre mutant; error bars depict standard deviation (n=3). D–E: Cell proliferation is dramatically reduced in Rac1-deficient neural crest (NC)-derived palatal mesenchyme at E13 (E) relative to control (D) (BrdU incorporation assay: BrdU-labelled nuclei red, (white arrowheads), counterstain DAPI blue; D, control; E, mutant). Yellow arrowheads in B and E point to sites of epithelial detachment, hatched lines in D and E define the lateral boarder of the palatal shelf mesenchyme. F–G: TUNEL staining (green; counterstain DAPI blue) of the midline frontal craniofacial region showing signal in the highly hypocellular NC-derived mesenchyme of a Rac1/Wnt1-Cre mutant sample (G, white arrowhead) compared to a corresponding control specimen (F). H–K: TUNEL staining (green; counterstain DAPI blue) in the largely NC-derived mesenchyme surrounding distal outflow tract (OFT) and abnormal downstream vessels (white arrowheads in I,K) and also in the AP-septum-like structure (yellow arrow in I) shows more apoptosis in Rac1/Wnt1-Cre mutants when compared to equivalent regions in controls (white arrowheads in H and J). L–N: NC-derived OFT cushion mesenchymal cells (blue: R26R fate determination assay; black arrows) in Rac1/Wnt1-Cre mutants (M) appear more often rounder, with shorter cellular projections, than the corresponding control cells (L). Black arrows (L) point to elongated cells; black arrowheads (L, M) point to round cells. Bar chart (N) shows quantification of the cell shape differences: Percentage of cells with a length:width ratio ≥ 2 shown for controls (blue column) and mutants (red column); error bars show standard deviation (n=3); *p<0.05 (Wilcoxon rank sum test). Scale bars indicate 250μm in D and H–L, and 500μm in F (E as D; I as J; G as F).
Fig. 8
Fig. 8. Abnormal outflow tract and vessel wall differentiation in Rac1/Wnt1-Cre mutants
Immunostaining for MF20 in distal outflow tract (OFT) of control E10 heart (A) shows a continuous sleeve of expression to the body wall reflection (white arrowhead) but in mutant (B) MF20-expressing cells are aberrantly located (white arrows). Low power images shown in insets (A,B). At E11, neural crest cells (NCCs) deficient in Rac1 (D) immunostained for smooth muscle α-actin (SMα–A) form a more extensive and irregular layer (arrow heads) around the proximal arterial vessels than those in controls (C). E,F: Transmission electron micrographs of putative smooth muscle cells adjacent to endothelial cells in a position slightly distal to one such as in C,D. Distinctive semi-organized f-actin bundles shown in inset E (black arrowhead) could be found in many control cells but none of the mutant cells (F) examined. AS, aortic sac; CAT, common arterial trunk; SMC, smooth muscle cell; SMC-L, SMC-like cell in mutant; EC, endothelial cell. Scale bars indicate either 250μm (B as A), 200μm (D as C) or 500μm (E and inset, F).

Similar articles

Cited by

References

    1. Aznar S, Lacal JC. Rho signals to cell growth and apoptosis. Cancer Lett. 2001;165:1–10. - PubMed
    1. Barlow LA. Cranial nerve development: placodal neurons ride the crest. Curr Biol. 2002;12:R171–173. - PubMed
    1. Bradshaw L, Chaudhry B, Hildreth V, Webb S, Henderson DJ. Dual role for neural crest cells during outflow tract septation in the neural crest-deficient mutant Splotch(2H) J Anat. 2009;214:245–257. - PMC - PubMed
    1. Breau MA, Dahmani A, Broders-Bondon F, Thiery JP, Dufour S. {beta}1 integrins are required for the invasion of the caecum and proximal hindgut by enteric neural crest cells. Development. 2009;136:2791–2801. - PubMed
    1. Brown CB, Baldwin HS. Neural crest contribution to the cardiovascular system. Adv Exp Med Biol. 2006;589:134–154. - PubMed

Publication types

Substances