Interplay of voltage and Ca-dependent inactivation of L-type Ca current
- PMID: 20184915
- PMCID: PMC2907421
- DOI: 10.1016/j.pbiomolbio.2010.02.001
Interplay of voltage and Ca-dependent inactivation of L-type Ca current
Abstract
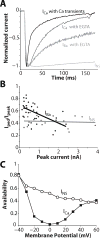
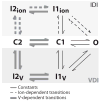
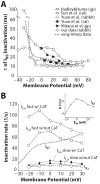
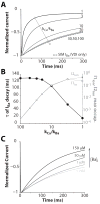
Inactivation of L-type Ca channels (LTCC) is regulated by both Ca and voltage-dependent processes (CDI and VDI). To differentiate VDI and CDI, several experimental and theoretical studies have considered the inactivation of Ba current through LTCC (I(Ba)) as a measure of VDI. However, there is evidence that Ba can weakly mimic Ca, such that I(Ba) inactivation is still a mixture of CDI and VDI. To avoid this complication, some have used the monovalent cation current through LTCC (I(NS)), which can be measured when divalent cation concentrations are very low. Notably, I(NS) inactivation rate does not depend on current amplitude, and hence may reflect purely VDI. However, based on analysis of existent and new data, and modeling, we find that I(NS) can inactivate more rapidly and completely than I(Ba), especially at physiological temperature. Thus VDI that occurs during I(Ba) (or I(Ca)) must differ intrinsically from VDI during I(NS). To account for this, we have extended a previously published LTCC mathematical model of VDI and CDI into an excitation-contraction coupling model, and assessed whether and how experimental I(Ba) inactivation results (traditionally used in VDI experiments and models) could be recapitulated by modifying CDI to account for Ba-dependent inactivation. Thus, the view of a slow and incomplete I(NS) inactivation should be revised, and I(NS) inactivation is a poor measure of VDI during I(Ca) or I(Ba). This complicates VDI analysis experimentally, but raises intriguing new questions about how the molecular mechanisms of VDI differ for divalent and monovalent currents through LTCCs.
2010 Elsevier Ltd. All rights reserved.
Figures


Similar articles
-
Theoretical study of L-type Ca(2+) current inactivation kinetics during action potential repolarization and early afterdepolarizations.J Physiol. 2012 Sep 15;590(18):4465-81. doi: 10.1113/jphysiol.2012.231886. Epub 2012 May 14. J Physiol. 2012. PMID: 22586219 Free PMC article.
-
Physiological modulation of inactivation in L-type Ca2+ channels: one switch.J Physiol. 2004 Jan 15;554(Pt 2):275-83. doi: 10.1113/jphysiol.2003.047902. Epub 2003 Jun 24. J Physiol. 2004. PMID: 12824441 Free PMC article. Review.
-
Calcium-dependent inactivation controls cardiac L-type Ca2+ currents under β-adrenergic stimulation.J Gen Physiol. 2019 Jun 3;151(6):786-797. doi: 10.1085/jgp.201812236. Epub 2019 Feb 27. J Gen Physiol. 2019. PMID: 30814137 Free PMC article.
-
Voltage- and calcium-dependent inactivation in high voltage-gated Ca(2+) channels.Prog Biophys Mol Biol. 2006 Jan-Apr;90(1-3):104-17. doi: 10.1016/j.pbiomolbio.2005.05.013. Epub 2005 Jul 1. Prog Biophys Mol Biol. 2006. PMID: 16038964 Review.
-
Quantitative aspects of L-type Ca2+ currents.Prog Neurobiol. 2012 Jan;96(1):1-31. doi: 10.1016/j.pneurobio.2011.09.010. Epub 2011 Oct 8. Prog Neurobiol. 2012. PMID: 22008116 Review.
Cited by
-
Arrhythmogenesis in a catecholaminergic polymorphic ventricular tachycardia mutation that depresses ryanodine receptor function.Proc Natl Acad Sci U S A. 2015 Mar 31;112(13):E1669-77. doi: 10.1073/pnas.1419795112. Epub 2015 Mar 16. Proc Natl Acad Sci U S A. 2015. PMID: 25775566 Free PMC article.
-
Rad GTPase deletion increases L-type calcium channel current leading to increased cardiac contraction.J Am Heart Assoc. 2013 Dec 12;2(6):e000459. doi: 10.1161/JAHA.113.000459. J Am Heart Assoc. 2013. PMID: 24334906 Free PMC article.
-
How Ca2+ influx is attenuated in the heart during a "fight or flight" response.J Gen Physiol. 2019 Jun 3;151(6):722-726. doi: 10.1085/jgp.201912338. Epub 2019 Apr 19. J Gen Physiol. 2019. PMID: 31004065 Free PMC article.
-
Calmodulin mutations associated with long QT syndrome prevent inactivation of cardiac L-type Ca(2+) currents and promote proarrhythmic behavior in ventricular myocytes.J Mol Cell Cardiol. 2014 Sep;74:115-24. doi: 10.1016/j.yjmcc.2014.04.022. Epub 2014 May 8. J Mol Cell Cardiol. 2014. PMID: 24816216 Free PMC article.
-
Enhanced Depolarization Drive in Failing Rabbit Ventricular Myocytes: Calcium-Dependent and β-Adrenergic Effects on Late Sodium, L-Type Calcium, and Sodium-Calcium Exchange Currents.Circ Arrhythm Electrophysiol. 2019 Mar;12(3):e007061. doi: 10.1161/CIRCEP.118.007061. Circ Arrhythm Electrophysiol. 2019. PMID: 30879336 Free PMC article.
References
-
- Bers DM. Excitation-Contraction Coupling and Cardiac Contractile Force. Kluwer Academic Press; Dordrecht, The Netherlands: 2001. p. 427.
-
- Brehm P, Eckert R. Calcium entry leads to inactivation of calcium channel in Paramecium. Science. 1978;202:1203–6. - PubMed
Publication types
MeSH terms
Substances
Grants and funding
LinkOut - more resources
Full Text Sources
Miscellaneous

