. 2010 Apr 15;26(8):1057-63.
doi: 10.1093/bioinformatics/btq076. Epub 2010 Feb 24.

The power of protein interaction networks for associating genes with diseases

Affiliations

The power of protein interaction networks for associating genes with diseases

Saket Navlakha et al. Bioinformatics. .

Abstract

Motivation: Understanding the association between genetic diseases and their causal genes is an important problem concerning human health. With the recent influx of high-throughput data describing interactions between gene products, scientists have been provided a new avenue through which these associations can be inferred. Despite the recent interest in this problem, however, there is little understanding of the relative benefits and drawbacks underlying the proposed techniques.

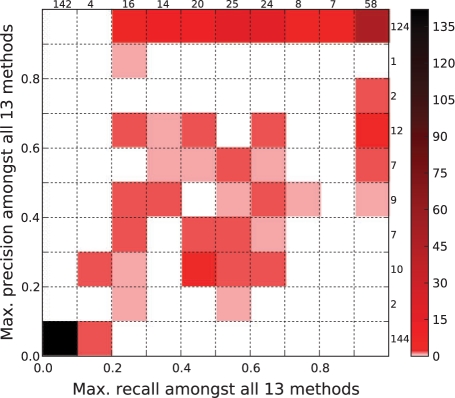
Results: We assessed the utility of physical protein interactions for determining gene-disease associations by examining the performance of seven recently developed computational methods (plus several of their variants). We found that random-walk approaches individually outperform clustering and neighborhood approaches, although most methods make predictions not made by any other method. We show how combining these methods into a consensus method yields Pareto optimal performance. We also quantified how a diffuse topological distribution of disease-related proteins negatively affects prediction quality and are thus able to identify diseases especially amenable to network-based predictions and others for which additional information sources are absolutely required.

Availability: The predictions made by each algorithm considered are available online at http://www.cbcb.umd.edu/DiseaseNet.


Figures

Fig. 1.
Fig. 1.
(a) The disease annotations (if any) are discarded from one protein p (double-circled node), and an attempt is made to predict these annotations as follows. (b) For each disease d, an algorithm A is used to give a score A(p, d) measuring how much p appears to be associated with disease d. If A(p, d)≥θ, the p-d association is considered as a candidate. (c) Finally, candidates are filtered based on genetic intervals known to be associated with disease. A p-d association is predicted if A(p, d)≥θ and p lies in a chromosomic interval known to be associated with disease d.
Fig. 2.
Fig. 2.
Performance of the methods. (a) Precision and recall for each method using leave-one-out cross-validation on the HPRD network. The random walk methods individually perform the best, followed by the clustering and neighborhood approaches. The consensus method, which combines predictions made by all methods using a Random Forest classifier, outperforms all other methods. (b) A magnification of the dashed region corresponding to the clustering methods.
Fig. 3.
Fig. 3.
Upper bound on achievable performance. Each (x, y) square is colored by the number of diseases that had maximum recall x and maximum precision y across all 13 methods using the prediction threshold for each method corresponding to roughly 10% recall.
Fig. 4.
Fig. 4.
Disease homophily versus prediction quality. The effect of disease homphily on the quality of the predictions made for that disease. The x-axes correspond to homophily, measured via (a) neighborhood homophily, and (b) the average pairwise distance of a disease. The y-axes are the F1-measure (harmonic mean of precision and recall) of the predictions for the disease. Least squares fit lines are shown for each method, with regression values in the legend. Vertical bars indicate variance. The trends uniformly indicate that the lower the average pairwise distance and higher the percentage of similarly annotated neighbors, the better the predictions. Numbers in bars give the count of diseases with the given level of homophily.

Similar articles

Cited by

References

    1. Aerts S, et al. Gene prioritization through genomic data fusion. Nat. Biotechnol. 2006;24:537–544. - PubMed
    1. Ashburner M, et al. Gene Ontology: tool for the unification of biology. Nat. Genet. 2000;25:25–29. - PMC - PubMed
    1. Birnbaum S, et al. Key susceptibility locus for nonsyndromic cleft lip with or without cleft palate on chromosome 8q24. Nat. Genet. 2009;41:473–477. - PubMed
    1. Breiman L. Random forests. Mach. Learn. 2001;45:5–32.
    1. Brohee S, van Helden J. Evaluation of clustering algorithms for protein-protein interaction networks. BMC Bioinformatics. 2006;7:488–507. - PMC - PubMed

Publication types