. 2010 Jun 1;19(11):2113-22.
doi: 10.1093/hmg/ddq088. Epub 2010 Feb 25.

OPA1 disease alleles causing dominant optic atrophy have defects in cardiolipin-stimulated GTP hydrolysis and membrane tubulation

Affiliations

OPA1 disease alleles causing dominant optic atrophy have defects in cardiolipin-stimulated GTP hydrolysis and membrane tubulation

Tadato Ban et al. Hum Mol Genet. .

Abstract

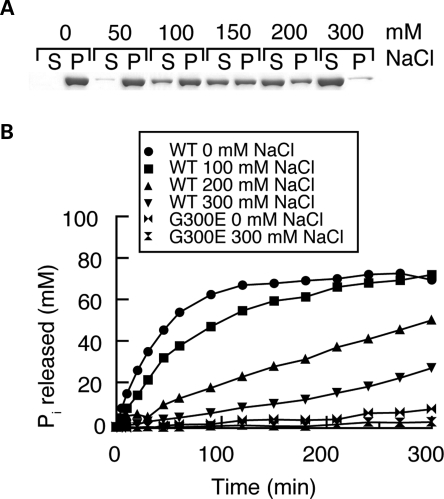
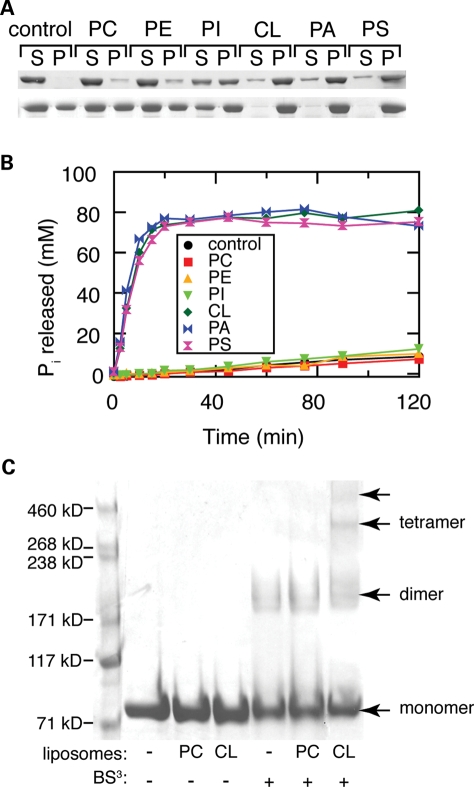
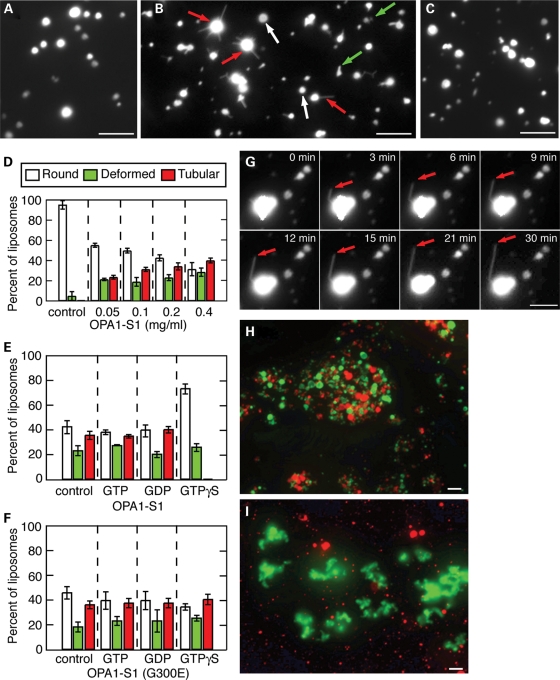
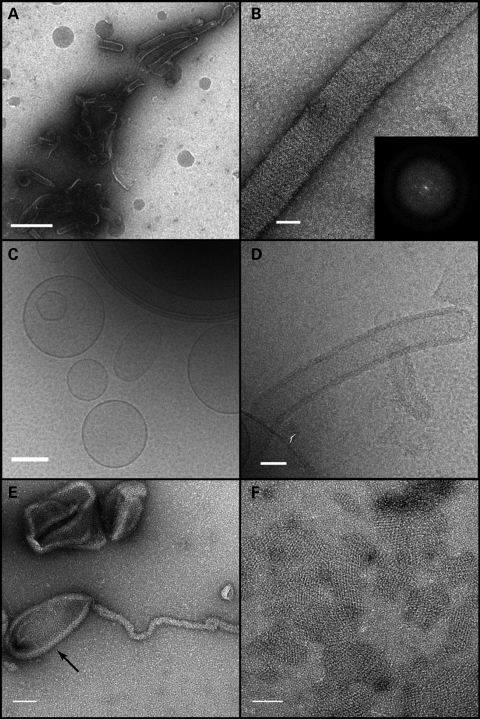
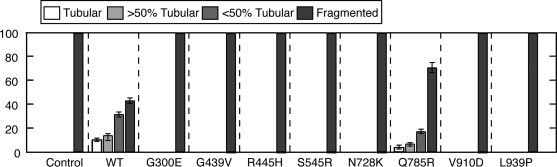
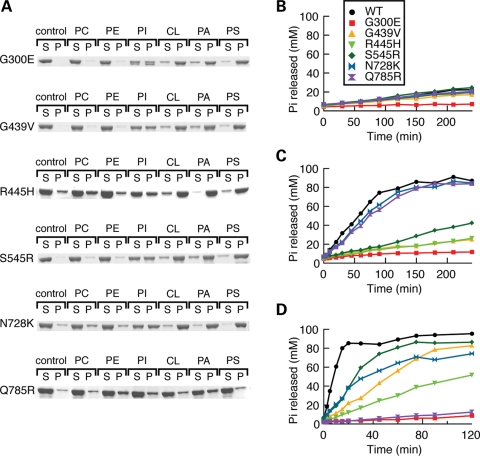
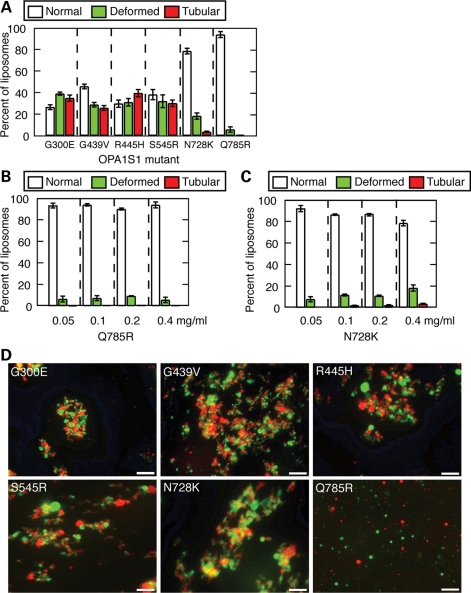
The dynamin-related GTPase OPA1 is mutated in autosomal dominant optic atrophy (DOA) (Kjer type), an inherited neuropathy of the retinal ganglion cells. OPA1 is essential for the fusion of the inner mitochondrial membranes, but its mechanism of action remains poorly understood. Here we show that OPA1 has a low basal rate of GTP hydrolysis that is dramatically enhanced by association with liposomes containing negative phospholipids such as cardiolipin. Lipid association triggers assembly of OPA1 into higher order oligomers. In addition, we find that OPA1 can promote the protrusion of lipid tubules from the surface of cardiolipin-containing liposomes. In such lipid protrusions, OPA1 assemblies are observed on the outside of the lipid tubule surface, a protein-membrane topology similar to that of classical dynamins. The membrane tubulation activity of OPA1 is suppressed by GTPgammaS. OPA1 disease alleles associated with DOA display selective defects in several activities, including cardiolipin association, GTP hydrolysis and membrane tubulation. These findings indicate that interaction of OPA1 with membranes can stimulate higher order assembly, enhance GTP hydrolysis and lead to membrane deformation into tubules.


Figures

Figure 1.
Figure 1.
Stimulation of OPA1-S1 GTPase activity by low-salt and liposome binding. (A) Sedimentation of OPA1-S1 under varying salt concentrations. OPA1-S1 was dialyzed against the indicated concentration of NaCl and centrifuged at 100 000g. The supernatant and pellet were analyzed by SDS–PAGE. S, supernatant; P, pellet. (B) GTP hydrolysis activity of wild-type and G300E OPA1 under varying salt concentrations. GTP hydrolysis was measured at 100 μm GTP with the indicated NaCl concentration.
Figure 2.
Figure 2.
Association of OPA1-S1 with artificial lipsomes. (A) Selective binding of OPA1-S1 to liposomes. OPA1-S1 was incubated with the indicated liposomes, and the mixture was centrifuged at 100 000g to sediment the liposomes. The sedimentation of OPA1-S1 was analyzed in 300 (top panel) and 150 mm NaCl (lower panel) by SDS–PAGE. S, supernatant; P, pellet; PC, 100% POPC; PE, 78% POPC, 22% POPE; PI, 70% POPC, 22% POPE, 8% PI; CL, 45% POPC, 22% POPE, 8% PI, 25% cardiolipin; PA, 45% POPC, 22% POPE, 8% PI, 25% POPA; PS, 45% POPC, 22% POPE, 8% PI, 25% POPS. Liposome binding was analyzed by centrifugation and SDS–PAGE. (B) Enhancement of GTP hydrolysis activity of wild-type OPA1 by liposomes. GTP hydrolysis was assayed at 100 μm GTP and 0.2 mg/ml liposome. All experiments were performed with 0.2 mg/ml OPA1-S1 at pH 7.0. (C) Higher order oligomers of OPA1 form upon interaction with cardiolipin-containing liposomes. The composition of the liposomes and the presence of the crosslinker (BS3) are indicated at the bottom. Arrows indicate distinct species of OPA1 resolved by SDS–PAGE.
Figure 3.
Figure 3.
Membrane tubulation and liposome aggregation by OPA1-S1. (AC) Images of fluorescently labeled liposomes. Immobilized cardiolipin-containing liposomes were incubated with buffer (A) or OPA1-S1 (B) and imaged by fluorescence microscopy after 30 min. In (C), PC liposomes were incubated with OPA1-S1. In (B), the arrows indicate examples of the three categories of liposome morphologies. White arrows indicate normal round liposomes; green arrows indicate liposomes with deformed borders but not clear tubulation; red arrows indicate liposomes with clear membrane tubulation. The concentration of OPA1-S1 and liposomes were both 0.2 mg/ml. (D) Quantification of OPA1-S1-mediated membrane tubulation at the indicated concentrations of OPA1-S1 and in the absence of guanine nucleotides. In the control, no protein was added. The ‘tubular’ category was defined as liposomes that contained one or more thin tubular extensions of at least 1 μm in length. This category therefore consisted of liposomes that showed unambiguous tubulation. The ‘deformed’ category was defined as liposomes that contained surface protrusions, but not meeting the tubular criteria. The ‘round’ category consisted of spherical liposomes with no surface protrusions. An electron micrograph showing tubular and deformed liposomes is shown in Supplementary Material, Figure S3. In each of three independent experiments, 200 liposomes were scored; error bars indicate standard deviations. (E) Effect of guanine nucleotides on liposome tubulation. OPA1 was incubated with Mg2+ (control) or Mg2+ and the indicated guanine nucleotide prior to the addition to cardiolipin-containing liposomes. In each of three independent experiments, more than 100 liposomes were scored; error bars indicate standard deviations. (F) Effect of guanine nucleotides on the GTPase mutant G300E was analyzed at in (E). (G) Time-lapse observation of OPA1-S1-mediated membrane tubulation from a cardiolipin-containing liposome. Arrows indicate extension of a >5 μm lipid tubule over the course of 30 min. The corresponding movie is shown in Supplementary Material, Video S1. (H and I) Liposome aggregation by OPA1-S1. OPA1-S1 was added to a mixture of DiO-labeled cardiolipin-containing liposomes (green) and DiI-labeled cardiolipin-containing liposomes (red) (H), or a mixture of DiO-labeled cardiolipin-containing liposomes and DiI=1,1'-dioctadecyl-3,3,3'3'-tetramethylindocarbocyanine perchlorate-labeled PC liposomes (I). In (I), note that only the cardiolipin-containing liposomes aggregate. The concentration of OPA1-S1 and liposomes were both 0.2 mg/ml. All scale bars are 5 μm.
Figure 4.
Figure 4.
Electron microscopy of liposome tubulation. (A and B) Negative stain of OPA1-S1 reconstituted with liposomes mimicking the mitochondrial inner membrane lipid. (A) A low magnification view showing OPA1-S1 tubular structures with diameters in the range of 50 to 150 nm. In (B), a higher magnification view shows an individual membrane tubule with a periodic arrangement of OPA1-S1 on the lipid substrate. The inset represents the Fourier transform of a segment of the displayed tube indicating molecular order mainly along the long axis of the tube. (C) Cryo-TEM image of vesicle preparations prior to the addition of OPA1-S1. Frozen–hydrated vesicles appear as a mixture of unilamellar and multilamellar vesicles of varying diameters. (D) Cryo-TEM of the vesicle preparation after the addition of OPA1-S1. OPA1-S1 reconstitutes into tubular structures with OPA1-S1 molecules decorating the surface of the lipid tubules. (E) Negative stain of OPA1 mixed with liposomes, showing that OPA1 assembles on the tubular as well as non-tubular (arrow) portions of the liposome. (F) Negative-stained preparation of an OPA1/liposome reaction, showing patches of OPA1 arrays. Scale bars: (A) 500 nm; (B and D) 50 nm; (C) 200 nm; (E and F) 100 nm.
Figure 5.
Figure 5.
Mitochondrial fusion activity of OPA1 disease alleles. The indicated alleles of OPA1 were expressed in OPA1-null MEFs by retroviral transduction, and mitochondrial morphology was scored using mitochondrially targeted DsRed. For each mutant, 100 cells were scored in each of three independent experiments; error bars indicate standard deviations. Control cells were not transduced with retrovirus.
Figure 6.
Figure 6.
Effects of DOA disease mutations in liposome-binding and GTP hydrolysis activity. (A) Liposome binding was measured by a liposome co-sedimentation assay, as in Fig. 2A. (BD) GTP hydrolysis activity was measured at 300 mm NaCl (B), 0 mm NaCl (C) and 300 mm NaCl with cardiolipin-containing liposomes (D).
Figure 7.
Figure 7.
Effects of DOA disease mutations on membrane tubulation and liposome aggregation. (A) Quantification of membrane tubulation by mutant alleles at 0.4 mg/ml, scored as in Fig. 3D. (B) Quantification of membrane tubulation by Q785R at varying concentrations. (C) Quantification of membrane tubulation by N728K. In (A–C), 200 liposomes were scored in each of three independent experiments, and error bars indicate standard deviations. (D) Images of DiO-labeled cardiolipin-containing liposomes (green) and DiI-labeled cardiolipin-containing liposomes (red) in the presence of OPA1-S1 mutant alleles, assayed as in Fig. 3H. Scale bars are 10 μm.

References

    1. Detmer S.A., Chan D.C. Functions and dysfunctions of mitochondrial dynamics. Nat. Rev. Mol. Cell Biol. 2007;8:870–879. doi:10.1038/nrm2275. - DOI - PubMed
    1. Song Z., Ghochani M., McCaffery J.M., Frey T.G., Chan D.C. Mitofusins and OPA1 mediate sequential steps in mitochondrial membrane fusion. Mol. Biol. Cell. 2009;20:3525–3532. doi:10.1091/mbc.E09-03-0252. - DOI - PMC - PubMed
    1. Herlan M., Vogel F., Bornhovd C., Neupert W., Reichert A.S. Processing of Mgm1 by the rhomboid-type protease Pcp1 is required for maintenance of mitochondrial morphology and of mitochondrial DNA. J. Biol. Chem. 2003;278:27781–27788. doi:10.1074/jbc.M211311200. - DOI - PubMed
    1. Song Z., Chen H., Fiket M., Alexander C., Chan D.C. OPA1 processing controls mitochondrial fusion and is regulated by mRNA splicing, membrane potential, and Yme1L. J. Cell Biol. 2007;178:749–755. doi:10.1083/jcb.200704110. - DOI - PMC - PubMed
    1. Meeusen S., DeVay R., Block J., Cassidy-Stone A., Wayson S., McCaffery J.M., Nunnari J. Mitochondrial inner-membrane fusion and crista maintenance requires the dynamin-related GTPase Mgm1. Cell. 2006;127:383–395. doi:10.1016/j.cell.2006.09.021. - DOI - PubMed

Publication types