Comparative Study
. 2010 Jun;38(10):e118.
doi: 10.1093/nar/gkq107. Epub 2010 Feb 25.

Assessing serotonin receptor mRNA editing frequency by a novel ultra high-throughput sequencing method

Affiliations
Comparative Study

Assessing serotonin receptor mRNA editing frequency by a novel ultra high-throughput sequencing method

Atheir I Abbas et al. Nucleic Acids Res. 2010 Jun.

Abstract

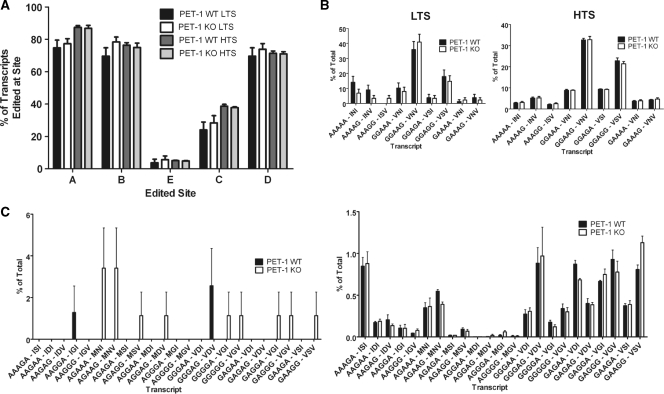
RNA editing is a post-transcriptional modification of pre-mRNA that results in increased diversity in transcriptomes and proteomes. It occurs in a wide variety of eukaryotic organisms and in some viruses. One of the most common forms of pre-mRNA editing is A-to-I editing, in which adenosine is deaminated to inosine, which is read as guanosine during translation. This phenomenon has been observed in numerous transcripts, including the mammalian 5-HT(2C) receptor, which can be edited at five distinct sites. Methods used to date to quantify 5-HT(2C) receptor editing are labor-intensive, expensive and provide limited information regarding the relative abundance of 5-HT(2C) receptor editing variants. Here, we present a novel, ultra high-throughput method to quantify 5-HT(2C) receptor editing, compare it to a more conventional method, and use it to assess the effect of a range of genetic and pharmacologic manipulations on 5-HT(2C) editing. We conclude that this new method is powerful and economical, and we provide evidence that alterations in 5-HT(2C) editing appear to be a result of regional changes in brain activity, rather than a mechanism to normalize 5-HT(2C) signaling.


Figures

Figure 1.
Figure 1.
Schematic of the ultra HTS strategy used to measure RNA editing. (A) A representative full-sequence read with the five edited sites labeled. Guanosines at edited sites correspond to inosines in the original RNA transcript from which the sequenced DNA is derived. (B) Ultra HTS sequencing produced 22 652 442/122 828 564 sequences. Non-edited region 1 and non-edited region 2 were used to filter sequences with misreads in those regions (13 790 980 sequences). Non-edited regions 3, 4 and 5 were then used to filter the remaining 8 861 462/92 958 400 sequences in a similar fashion to remove the sequences containing misreads in those regions, and theoretically impossible transcripts (in other words, those with a C or T at an edited site) were also filtered (213 997/21 770 405 sequences failed after applying the last two filters), leaving 8 647 465/71 187 995 sequences used for subsequent analysis.
Figure 2.
Figure 2.
(A) Comparison of editing frequencies by site as measured by LTS and HTS. The LTS and HTS approaches produce comparable estimates of editing frequencies by site. Two-way ANOVA analysis (HTS P-value = 0.4369; LTS P-value = 0.0812) and Bonferroni post-tests indicate that there is no effect of genotype on site editing frequency. (B) Comparison of common transcript frequencies as measured by LTS and HTS. Estimates derived by LTS and HTS are comparable. Two-way ANOVA analysis (HTS P-value = 0.9976; LTS P-value = 0.4011) and Bonferroni post-tests comparing common transcripts detected in both genotypes with both methods show no significant effect of genotype on transcript frequency differences. (C) Comparison of rare transcript frequencies as measured by LTS and HTS. No rare transcript is detected in both genotypes by LTS, so statistical comparison between genotypes is not possible. HTS, on the other hand, permits more sensitive estimation of rare transcript frequencies. Two-way ANOVA analysis (P-value = 0.9867) and Bonferroni post-tests of the HTS-generated rare transcript data shows that genotype has no significant effect on transcript frequency. LTS: N = 78 wild-types, N = 88 knockouts; HTS: N = 3 littermate pairs, 8 647 465 sequences total. Transcript frequencies are presented as means, expressed as a percentage of the total population of transcripts, ±SEM.
Figure 3.
Figure 3.
(A–C) Column 1comparison of editing frequencies by site after treatment with saline or drug daily for 28 days, in striatum, hippocampus and cortex. Two-way ANOVA analysis (P < 0.0001) and Bonferroni post-tests for pair-wise comparisons indicates that chronic fluoxetine and amitriptyline treatment leads to an increase in the proportion of transcripts edited at the A and B sites in striatum (fluoxetine) and hippocampus (fluoxetine and amitriptyline), with no effect on other sites. Column 2comparison of transcript frequencies by transcript group after treatment with saline or fluoxetine daily for 28 days in striatum, hippocampus, and cortex. Two-way ANOVA analysis (P < 0.0001) and Bonferroni post-tests for pair-wise comparisons indicates that fluoxetine (striatum and hippocampus) and amitriptyline (hippocampus) treatment lead to a decrease in the proportion of transcripts unedited at both the A and B sites (AA***), an increase in the proportion of transcripts edited at both the A and B sites (GG***), and no change in transcripts edited at either the A or B site (AG*** and GA***). N = 4 for each treatment regimen, with the estimates for each sample obtained by analyzing an average of 431 442 sequences. Editing frequencies and transcript frequencies are presented as means, expressed as a percentage of the total population of transcripts, ±SEM. *P < 0.05; **P < 0.01; ***P < 0.001.
Figure 4.
Figure 4.
(A) Comparison of editing frequencies by site after treatment with saline or drug daily for 14 days, in striatum. Two-way ANOVA analysis (P < 0.0001) and Bonferroni post-tests for pair-wise comparisons indicates that chronic SB206553 (14 D) treatment leads to an increase in the proportion of transcripts edited at the A and B sites in striatum, with no effect on other sites. Comparison of transcript frequencies by transcript group after treatment with saline or SB206553 daily for 14 days in striatum, hippocampus and cortex is consistent with the increase in A and B site editing. Two-way ANOVA analysis (P < 0.0001) and Bonferroni post-tests for pair-wise comparisons indicates that SB206553 treatment leads to a decrease in the proportion of transcripts unedited at both the A and B sites (AA***), an increase in the proportion of transcripts edited at both the A and B sites (GG***), and no change in transcripts edited at either the A or B site (AG*** and GA***). (B) Comparison of editing frequencies by site after treatment with saline or drug daily for 14 days in cortex. Two-way ANOVA analysis (P < 0.0001) and Bonferroni post-tests for pair-wise comparisons indicates that chronic lithium treatment leads to an increase in the proportion of transcripts edited at the C and D sites in striatum, with no effect on other sites. Comparison of transcript frequencies by transcript group after treatment with saline or lithium daily for 14 days in cortex is consistent with the increase in C and D site editing. Two-way ANOVA analysis (P < 0.0001) and Bonferroni post-tests for pair-wise comparisons indicates that lithium treatment leads to a decrease in the proportion of transcripts unedited at both the C and D sites (***AA), an increase in the proportion of transcripts edited at both the C and D sites (***GG), and no change in transcripts edited at either the C or D site (***AG and ***GA). N = 4 for each treatment regimen, with the estimates for each sample obtained by analyzing an average of 431 442 sequences. Editing frequencies and transcript frequencies are presented as means, expressed as a percentage of the total population of transcripts, ±SEM. *P < 0.05; **P < 0.01; ***P < 0.001.

Similar articles

Cited by

References

    1. Benne R, Van den Burg J, Brakenhoff JP, Sloof P, Van Boom JH, Tromp MC. Major transcript of the frameshifted coxII gene from trypanosome mitochondria contains four nucleotides that are not encoded in the DNA. Cell. 1986;46:819–826. - PubMed
    1. Keegan LP, Gallo A, O'Connell MA. The many roles of an RNA editor. Nat. Rev. Genet. 2001;2:869–878. - PubMed
    1. Sommer B, Kohler M, Sprengel R, Seeburg PH. RNA editing in brain controls a determinant of ion flow in glutamate-gated channels. Cell. 1991;67:11–19. - PubMed
    1. Bass BL. RNA editing by adenosine deaminases that act on RNA. Annu. Rev. Biochem. 2002;71:817–846. - PMC - PubMed
    1. Palladino MJ, Keegan LP, O'Connell MA, Reenan RA. A-to-I pre-mRNA editing in Drosophila is primarily involved in adult nervous system function and integrity. Cell. 2000;102:437–449. - PubMed

Publication types