. 2010 Apr 22;115(16):3258-68.
doi: 10.1182/blood-2009-11-255497. Epub 2010 Feb 25.

Extreme lymphoproliferative disease and fatal autoimmune thrombocytopenia in FasL and TRAIL double-deficient mice

Affiliations

Extreme lymphoproliferative disease and fatal autoimmune thrombocytopenia in FasL and TRAIL double-deficient mice

Lisa M Sedger et al. Blood. .

Abstract

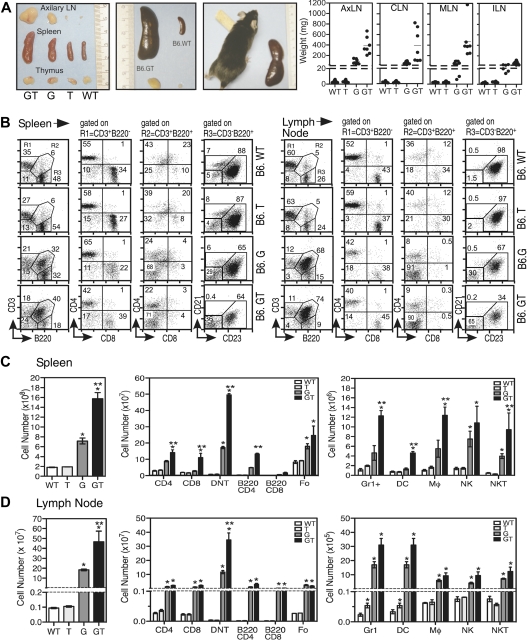
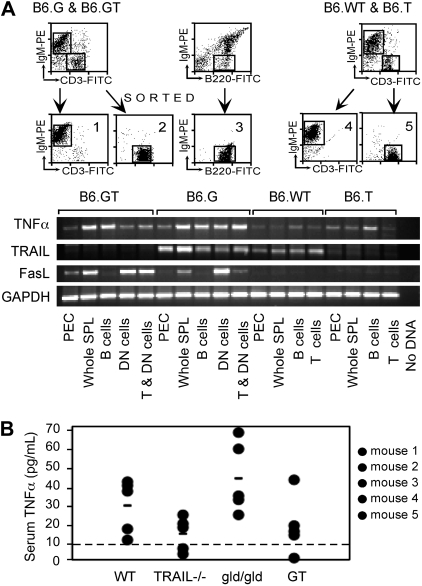
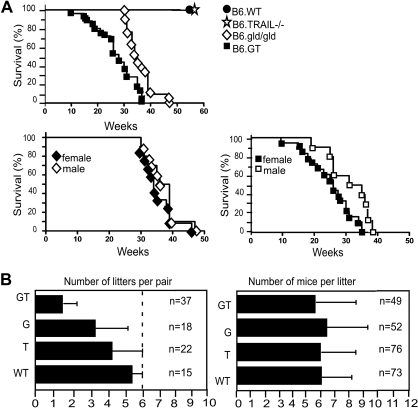
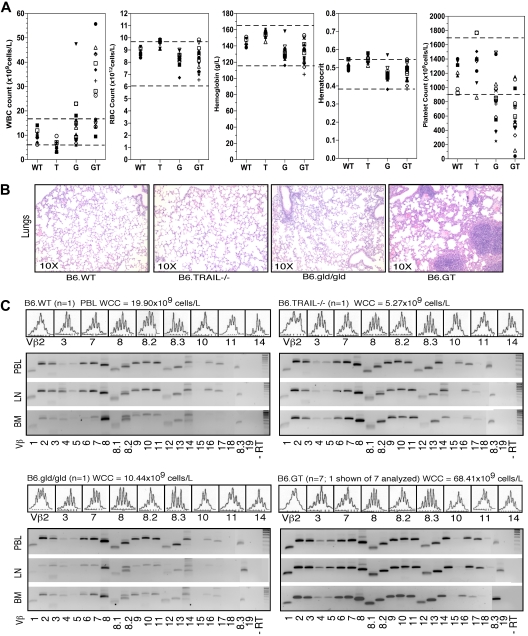
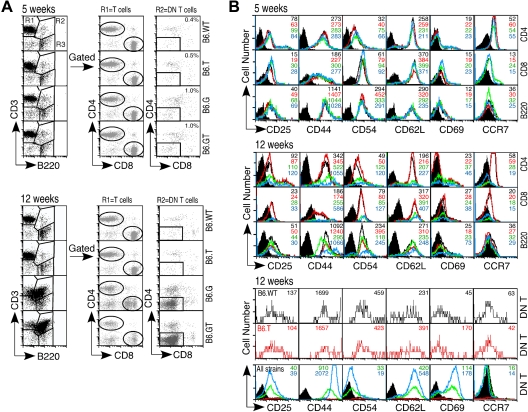
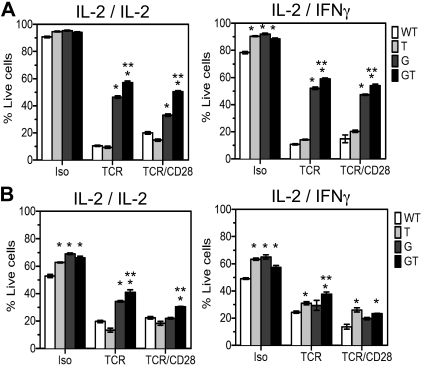
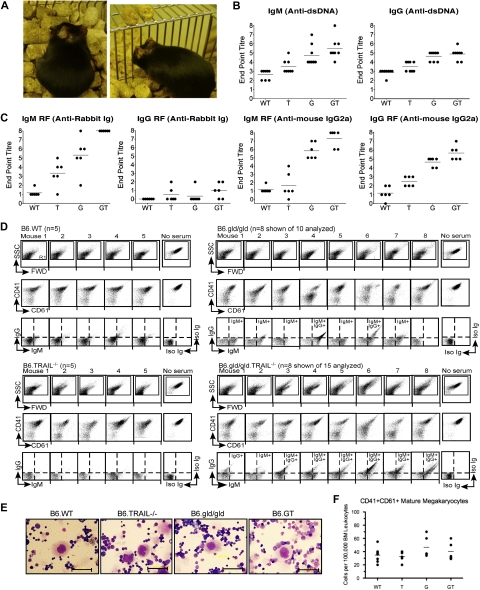
To delineate the relative roles of tumor necrosis factor-related apoptosis-inducing ligand (TRAIL) and Fas ligand in lymphocyte biology and lymphoproliferative disease, we generated mice defective in both molecules. B6.GT mice develop severe polyclonal lymphoproliferative disease because of accumulating CD3(+)CD4(-)CD8(-)B220(+) T cells, CD4(+) and CD8(+) T cells, and follicular B cells, and mice die prematurely from extreme lymphocytosis, thrombocytopenia, and hemorrhage. Accumulating lymphocytes resembled antigen-experienced lymphocytes, consistent with the maximal resistance of B6.GT CD4(+) and CD8(+) T cell to activation-induced cell death. More specifically, we show that TRAIL contributes to Fas ligand-mediated activation-induced cell death and controls lymphocyte apoptosis in the presence of interferon-gamma once antigen stimulation is removed. Furthermore, dysregulated lymphocyte homeostasis results in the production of anti-DNA and rheumatoid factor autoantibodies, as well as antiplatelet IgM and IgG causing thrombocytopenia. Thus, B6.GT mice reveal new roles for TRAIL in lymphocyte homeostasis and autoimmune lymphoproliferative syndromes and are a model of spontaneous idiopathic thrombocytopenia purpura secondary to lymphoproliferative disease.


Figures

Figure 1
Figure 1
Analysis of immunologic organs of B6.GT mice. (A) Gross thymus, lymph node, and spleen organ size in age-matched B6.WT, B6.TRAIL−/−, B6.gld/gld, and B6.GT mice. Figures show 1 mouse per strain, with 5 or more mice per strain analyzed, as indicated in lymph node weight data. (B) Percentage of conventional CD3+B220 T cells (R1), as well as CD3+B220+ (R2) CD4CD8“double negative” T cells (DN T cells) and CD3B220+ B cells as CD21CD23+ follicular (Fo) B cells, CD21+CD23 marginal zone (MZ) B cells, and CD21CD23 nonfollicular (NF) B cells in spleen and axillary lymph nodes of 3 age- and sex-matched B6.WT, B6.TRAIL (B6.T), B6.gld/gld (B6.G), and B6.gld/gld.TRAIL−/− (B6.GT) mice. FACS data (dot plots) shown are from 1 representative mouse of 3 age- and sex-matched mice per strain. (C-D) Total leukocyte cellularity and absolute numbers of T cell, B cell, and DN T cell leukocyte subsets calculated from dot plots in panel B. Numbers of non T and B cells were determined by gating first on CD3B220 cells and subsequently on Gr1+, CD11c+, or NK1.1+ cells, whereas NKT cells were defined from within the CD3+B220 cells that expressed NK1.1. Data shown are mean plus or minus SD of each tissue from 3 mice per strain. Statistical significance was assessed using Mann-Whitney analysis, with differences between B6.gld/gld or B6.GT compared with B6.WT (*P < .05) and between B6.G and B6.GT (**P < .05).
Figure 2
Figure 2
TNF-α expression in B6.GT mice. (A) RNA was purified from 106 FACS sort-purified murine spleen IgM+ B cells, CD3+ conventional T cells, or IgMCD3+B220+ DN T cells, or from peritoneal exudate cells (PEC), for assessment of TNF-α, TRAIL, FasL, and GAPDH mRNA levels by conventional semiquantitative RT-PCR. Data shown are representative of 2 independently repeated PCR analyses for each mRNA. (B) Serum TNF-α protein assessed by ELISA assay and quantitated relative to a recombinant murine TNF-α as a standard, with the limit of detection of TNF-α protein of approximately 10 pg/mL (line). Data shown are representative of an independently repeated TNF-α ELISA.
Figure 3
Figure 3
Survival and breeding potential. (A) Mice were monitored from birth, until their sudden death, or until they were killed (having become moribund), in full accordance with Western Sydney Area Health Service institutional animal ethics guidelines. Kaplan-Meier graphs were plotted with survival data from 10 B6.WT, 12 B6.TRAIL−/−, 21 B6.gld/gld, and 25 B6.GT mice. Data were analyzed with log-rank test that indicated a statistically significant difference of P < .001 between B6.G and B6.GT. A statistically significance difference (P = .012) was also evident between female versus male B6.GT mice, but no significant difference was found for male versus female B6.gld/gld (P = .233). (B) Breeding potential was assessed by reviewing the number of litters per breeder pair and number of mice per litter, with data from long-term breeding records over 4 years. Male and female mice were mated at approximately 6 to 7 weeks of age, with pups weaned at approximately 3 weeks of age, and male mice were left with their female partners to allow postpartum mating.
Figure 4
Figure 4
Hematologic assessed of B6.GT mice. (A) Peripheral blood hematology analysis of mouse blood collected from individual B6.WT (n = 7), B6.TRAIL−/− (n = 8), B6.gld/gld (n = 16), and B6.GT (n = 15) mice, more than 20 weeks of age. Blood was collected from freshly killed mice directly from the inferior vena cava into 5 mL potassium K2-EDTA acid-coated blood collection tubes and analyzed within 4 hours of collection on an ADIVA120 Hematology System analyzer. Each symbol differentiates an individual mouse across all hematologic parameters assessed. The normal range of each parameter in mouse blood is shown (dashed lines). (B) Lung histology. Hematoxylin and eosin staining of formalin-fixed paraffin-embedded lung tissues. Shown are sections of lung tissue from 1 representative B6.WT, B6.TRAIL−/−, B6.gld/gld, and B6.GT mouse, and data are representative of repeated analysis of independently generated mouse cohorts. (C) Assessment of T cell and DN T cell clonality as determined by conventional RT-PCR of Vβ-specific TCR CDR3 mRNAs, using RNA obtained from mouse bone marrow (BM), axillary lymph node (LN), and peripheral blood leukocytes (PBL) from a representative mouse 20 weeks of age or older from each strain, or from 7 B6.GT mice. Broad clonality was confirmed using spectratyping analysis on each PCR product. Spectratyping data shown are from PBL TCR Vβ-specific RT-PCR products, with the correlating total white cell counts for the individual mouse, as indicated.
Figure 5
Figure 5
Lymphocyte activation marker expression. Axillary lymph node lymphocytes from 5- and 12-week-old mice were assessed for expression of activation status molecules using multicolor flow cytometry. (A) Lymphocytes were gated first on CD3+B220 (R1) and CD4 or CD8 to designate mature peripheral conventional T lymphocyte subsets, or on CD3+B220+ (R2) and then CD4CD8 DN T cells, or on CD3B220+ (R3) B cells. (B) Expression of CD25, CD44, CD54, CD62L, CD69, and the chemokine receptor CCR7 was determined on each of these lymphocyte subsets. Data shown are histogram overlays with mean fluorescent intensity of individual histograms, indicating relative expression levels of each activation-status molecule on young (5-week-old) or older (12-week-old) B6.WT (black unfilled histogram), B6.TRAIL−/− (red unfilled histogram), B6.gld/gld (unfilled green histogram), and B6.GT (blue unfilled histogram). Data are shown compared with B6.WT control Ig-stained cells (black filled histograms) for CD4+, CD8+, and B200+ cells, or B6.G control stained DN T cells (black filled histograms). Data shown are representative of repeated analysis of independently generated mouse cohorts.
Figure 6
Figure 6
AICD of lymph node T cells from B6.GT mice. Lymphocyte blasts were prepared from single cell suspensions of pooled axillary and brachial lymph node lymphocytes from B6.WT, B6.TRAIL−/−, B6.gld/gld, or B6.GT naive 5-week-old mice. Cells were cultured for 3 days on TCRVβ- and CD28-agonistic antibody-coated tissue culture plates and restimulated for 48 hours with isotype control, TCRVβ-, or TCRVβ- and CD28-agonistic antibodies in the presence of recombinant murine IL-2 or recombinant murine IFN-γ during the primary or secondary culture, as indicated. Cells were harvested and incubated with CD4-Pacific blue or CD8-PECy7-conjugated antibodies and stained with propidium iodide and annexin V-FITC and analyzed by flow cytometry. Data are the mean percentage of propidium iodide-negative annexin V-negative live cells plus or minus SD of triplicate cultures of (A) CD4+ T cells or (B) CD8+ T cells. AICD data were analyzed by 1-way analysis of variance, and significant differences (P < .05) relative to B6.WT cells (*) or relative to AICD of B6.gld/gld cells (**) are as indicated. Data shown are representative of repeated experiments on cells from independently generated mouse cohorts.
Figure 7
Figure 7
Autoantibody production in B6.GT mice. (A) Spontaneous autoimmune skin lesions and ear pinna erosion in old B6.GT mice. (B) IgM and IgG anti–double-stranded DNA-specific autoantibodies in serum from 5 age-matched female B6.WT, B6.TRAIL−/−, B6.gld/gld, and B6.GT mice. Shown are endpoint titers of individual mouse sera (●) and mean autoantibody levels (horizontal line) of 5 mice per strain. (C) IgM and IgG rheumatoid factor antibodies: anti–rabbit Ig, or anti–mouse IgG2a antibodies, determined by standard ELISA, on serum from 5 age-matched female B6.WT, B6.TRAIL−/−, B6.gld/gld, and B6.GT mice. Endpoint titers (●) and mean autoantibody levels are shown (horizontal line). (D) FACS analysis of B6.WT platelet-bound IgG and IgM autoantibodies in K2EDTA-anticoagulated serum obtained from old B6.WT (n = 5), B6.TRAIL−/− (n = 5), B6.gld/gld (n = 10 shown of 15 analyzed), or B6.GT mice (n = 10 shown of 15 analyzed). Serum antiplatelet antibody capacity to block detection of CD41 and CD61 is also shown. Log scale SSC/FWD scatter platelet events were gated to exclude 99.9% of electronic noise. (E) Visualization of megakaryocytes in Wright Giemsa-stained bone marrow smears. Scale bar represents 50 μm. (F) Enumeration of CD41hiCD61hi bone marrow megakaryocytes per 100 000 bone marrow leukocytes as determined by flow cytometry. Data are individual bone marrow megakaryocytes per pair mouse femurs (●), and means of bone marrow megakaryocytes from 5 mice per strain (horizontal line), calculated from CD41 versus CD61 dot plots of FWD-area large cells (< 0.5% events), pregated for singlet cells determined from FWD-height versus FWD-area dot plots (supplemental Figure 3). No statistically significant differences were found between any strains by 1-way analysis of variance.

References

    1. Strasser A. Apoptosis signalling. Annu Rev Biochem. 2000;69:217–245. - PubMed
    1. Aggarwal BB, Shishodia S, Ashikawa K, Bharti AC. The role of TNF and its family members in inflammation and cancer: lessons from gene deletion. Curr Drug Targets Inflamm Allergy. 2002;1(4):327–341. - PubMed
    1. Ruby J, Bluethmann H, Peschon JJ. Antiviral activity of tumor necrosis factor (TNF) is mediated via p55 and p75 TNF receptors. J Exp Med. 1997;186(9):1591–1596. - PMC - PubMed
    1. Adachi M, Suematsu S, Kondo T, et al. Targeted mutation in the Fas gene causes hyperplasia in peripheral lymphoid organs and liver. Nat Genet. 1995;11(3):294–300. - PubMed
    1. Wiley SR, Schooley K, Smolak PJ, et al. Identification and characterisation of a new member of the TNF family that induces apoptosis. Immunity. 1995;3(6):673–682. - PubMed

Publication types

MeSH terms