. 2010 May;298(5):G590-600.
doi: 10.1152/ajpgi.00470.2009. Epub 2010 Feb 25.

Sox9 expression marks a subset of CD24-expressing small intestine epithelial stem cells that form organoids in vitro

Affiliations

Sox9 expression marks a subset of CD24-expressing small intestine epithelial stem cells that form organoids in vitro

Adam D Gracz et al. Am J Physiol Gastrointest Liver Physiol. 2010 May.

Abstract

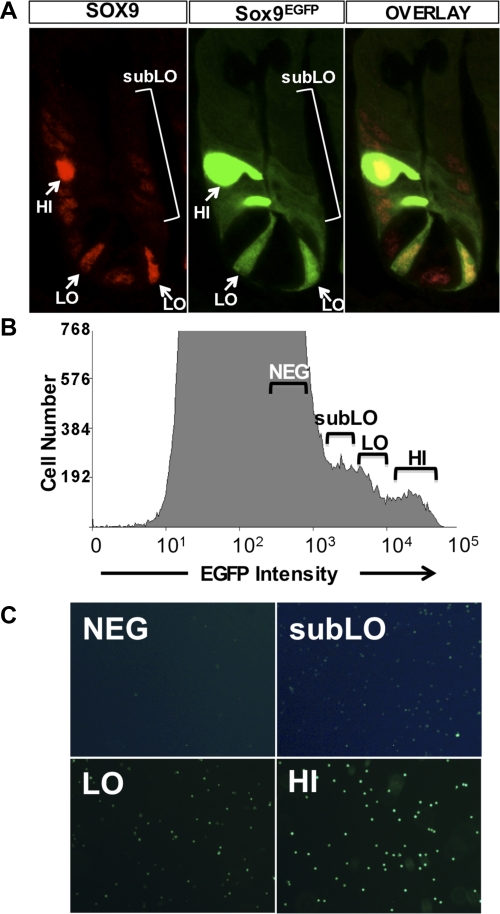
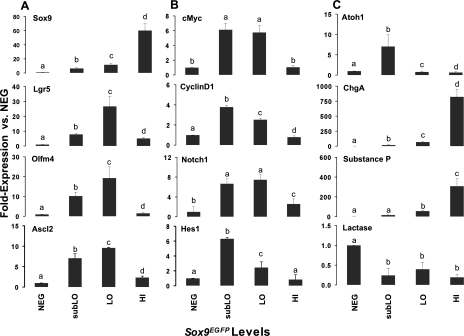
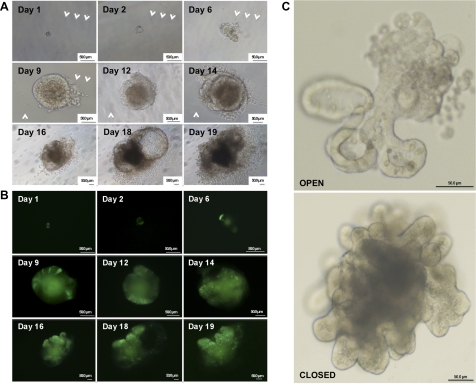
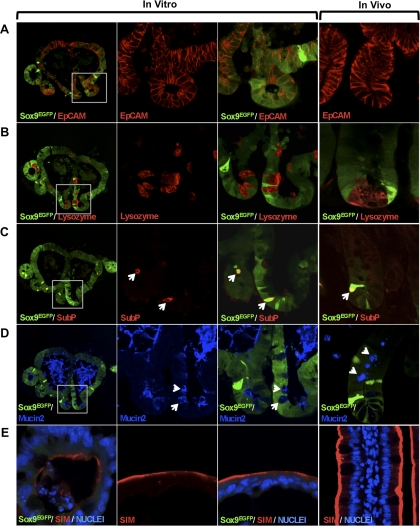
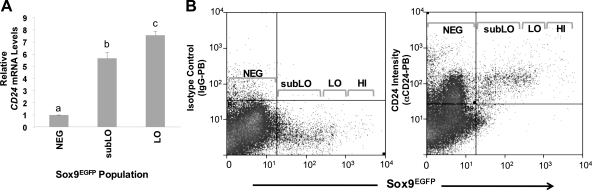
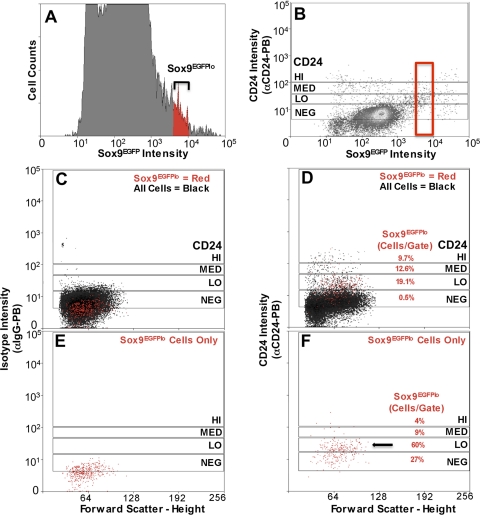
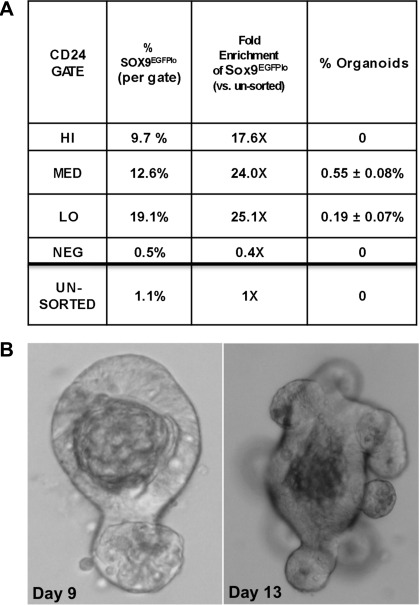
The inability to identify, isolate, and culture intestinal epithelial stem cells (IESCs) has been prohibitive to the study and therapeutic utilization of these cells. Using a Sox9(EGFP) mouse model, we demonstrate that Sox9(EGFP) fluorescence signatures can be used to differentiate between and enrich for progenitors (Sox9(EGFPsubLo)) and multipotent IESCs (Sox9(EGFPlo)). Sox9(EGFPlo) cells generate "organoids" in a recently defined culture system that mimics the native IESC niche. These organoids possess all four differentiated cell types of the small intestine epithelium, demonstrating the multipotent capacity of Sox9(EGFPlo) cells. Our results are consistent with the previously reported observation that single IESCs generate cryptlike units without a detectable mesenchymal cell component. A prospective search revealed that CD24 is expressed in the Sox9(EGFPlo) population and marks IESCs that form organoids in culture. CD24 represents the first cell surface marker that facilitates fluorescence-activated cell sorting enrichment of IESCs with widely available antibodies without requiring a specialized fluorescent reporter gene mouse model.


Figures

Fig. 1.
Fig. 1.
Sox9EGFP is expressed at 3 different levels in the small intestinal epithelium. A: Sox9EGFP is expressed at variable levels, “HI,” “LO,” and “subLO,” in the crypts of the small intestine. HI levels are associated with postmitotic enteroendocrine cells, LO levels are associated with crypt-base columnar cells, “subLO” levels are associated with the transit-amplifying region of the crypt, and NEG levels are Sox9EGFP negative. Images represent ×1,260 original magnification. B: flow cytometric analysis indicates distinct Sox9EGFP expression levels. Gate parameters used to sort each population are indicated above each region of the histogram. C: postsort analysis indicates that single Sox9EGFP-expressing cells have been isolated based on enhanced green fluorescent protein (EGFP) status. Images represent ×200 original magnification. The image exposures for Sox9EGFPneg and Sox9EGFsubLo panels were doubled to produce images that would allow visualization of EGFP expression in these 2 populations.
Fig. 2.
Fig. 2.
Gene expression analysis demonstrates isolation and enrichment of intestinal epithelial stem cells (IESCs), progenitors, and enteroendocrine cells by use of fluorescence-activated cell sorting (FACS). Semiquantitative RT-PCR conducted on FACSed NEG, subLO, LO, and HI cells demonstrates enrichment of IESC stem cell biomarkers in the LO populations (A), active Wnt/β-catenin and Notch1 signaling in subLO and LO populations (B), and enrichment of committed secretory progenitors in the subLO population and enteroendocrine cells in the HI population (C). Elevated lactase expression in the NEG population indicates this population is enriched for enterocytes. All data points represent means ± SE from 3 independent experiments; statistical analysis was by ANOVA and post hoc 2 sample t-tests were then performed. A P value <0.05 is considered statistically significant. Different letters above each bar represent data points that are statistically different from each other.
Fig. 3.
Fig. 3.
Single Sox9EGFPlo cells form complex organoids in vitro. A: single cells develop into large aggregates with crypt and villus-like structures over 7–10 days. The central pseudolumens of the single-cell-derived organoids expel apoptotic cells resulting from the sloughing of terminally differentiated epithelial cells. Arrows mark defects in culture plastic used as “landmarks” to track individual cells through early developmental phases into formed organoids. At day 9 the organoid grew large enough to obscure the tracking defects; therefore, additional tracking marks were identified (white arrows). B: epifluorescent images of organoids depicted in A. Note that the green pseudolumen is nonspecific autofluorescence and not EGFP fluorescence. Differential Sox9EGFP expression patterning remains evident throughout expansion in vitro. C: organoids form both open and closed morphologies, based on developmental positioning of the apoptotic pseudolumen. Apoptotic cells slough openly into Matrigel in the “open” morphology and are seen as a dense, dark region in the “closed” morphology. Ages of organoids are 12 days postsort (top) and 15 days postsort (bottom). Organoids are magnified ×300 (top) and ×200 (bottom).
Fig. 4.
Fig. 4.
Sox9EGFPlo cells are capable of differentiation into all postmitotic cell types associated with the intestinal epithelium. A: epithelial cell adhesion molecule (EpCAM) staining indicates organoids cells are epithelial. B: lysozyme marks Paneth cells near the base of cryptlike structures. C: enteroendocrine cells are labeled with Substance P and also restricted to the base of cryptlike structures in the organoids. D: Mucin2 demonstrates the goblet cell phenotype in cryptlike structures. Secreted Mucin2 in the pseudolumen suggests that goblet cells are correctly polarized. E: sucrase isolmaltase (SIM) labels the apical ends of enterocytes lining the pseudolumen in the organoids. White boxes in the far left images (×100 original magnification) represent areas magnified in the center 2 columns (×800 original magnification). White arrows point to representative cells. Associated expression patterns in vitro correlate with those observed in vivo (far right). The organoid represented was cultured for 12 days.
Fig. 5.
Fig. 5.
Small intestine epithelial stem/progenitor cells express CD24 mRNA and protein. A: semiquantitative RT-PCR (sqRT-PCR) demonstrates that CD24 is expressed 5.5- to 7.2-fold higher in the subLO and LO cells compared with Sox9EGFP-negative cells. All data points represent means ± SE from 3 independent experiments; statistical analysis was by ANOVA, and post hoc 2-sample t-tests were then performed. A P value <0.05 is considered statistically significant. Different letters above each bar represent data points that are statistically different from each other. B: flow cytometric analysis indicates that nearly all Sox9EGFP-positive cells express CD24 protein. Left: Pacific blue-conjugated isotype antibody control. αCD24-Pacific blue conjugated antibody. Right: gray brackets in the histograms represent the FACS gating parameters.
Fig. 6.
Fig. 6.
Flow cytometric analysis shows that a majority Sox9EGFPlo cells fall within CD24lo expression pattern. A: Sox9EGFP expression of dissociated small intestine epithelial cells on a univariate EGFP histogram. Black brackets indicate gate parameters. Color gating (red) allows visualization of Sox9EGFPlo population in histograms AF. B: Sox9EGFP/CD24 bivariate histogram used to define the 4 CD24 gate parameters [negative (NEG), low (LO), medium (MED), and high (HI)]. C and E: IgG control antibody indicates there is no significant nonspecific staining. D and F: αCD24-PB (Pacific blue) antibody labels 73% of Sox9EGFPlo cells. D: percentages represent the number of Sox9EGFPlo-expressing cells in each gate. Mean percentage ± SE for each population are as follows: NEG, 1.67 ± 0.25%; LO, 25.63 ± 0.95%; MED, 12.23 ± 1.48%; HI, 9.33 ± 0.91%. E and F: just Sox9EGFPlo cells color backgated onto the CD24/FSC histogram to highlight their distribution on the histogram. F: percentages represent the relative number of all Sox9EGFPlo cells in each gate. Mean percentage ± SE for each population are as follows: NEG, 50.7 ± 5.37%; LO, 42.47 ± 4.34%; MED, 10.23 ± 1.16%; HI, 0.50 ± 0.00%.
Fig. 7.
Fig. 7.
CD24 can be used as a biomarker to isolate and enrich for single cells capable of producing sustainable, differentiated organoids. A: table representing the enrichment of putative IESCs by using CD24 expression levels as sort criterion. Percent Sox9EGFPlo cells/gate = number of Sox9EGFPlo cells/total number of cells per gate. Fold enrichment, percent Sox9EGFPlo cells per gate/percent Sox9EGFPlo cells in all sorted cells. CD24lo sort parameters demonstrate the highest potential for enrichment of IESCs. There is a ×25.1 enrichment for Sox9EGFPlo cells in the CD24lo sort parameters compared with ungated cells. Organoid generating IESCs can be isolated only with the CD24lo (5 organoids in every 1,000 cells) and CD24med (1 organoid in every 1,000 cells) sort parameters. B: representative organoids derived from single CD24lo-expressing cells (left, day 9; right, day 13).

References

    1. Akiyama H, Kim JE, Nakashima K, Balmes G, Iwai N, Deng JM, Zhang Z, Martin JF, Behringer RR, Nakamura T, de Crombrugghe B. Osteo-chondroprogenitor cells are derived from Sox9 expressing precursors. Proc Natl Acad Sci USA 102: 14665–14670, 2005 - PMC - PubMed
    1. Akiyama H, Lyons JP, Mori-Akiyama Y, Yang X, Zhang R, Zhang Z, Deng JM, Taketo MM, Nakamura T, Behringer RR, McCrea PD, de Crombrugghe B. Interactions between Sox9 and beta-catenin control chondrocyte differentiation. Genes Devel 18: 1072–1087, 2004 - PMC - PubMed
    1. Al-Hajj M, Wicha MS, Benito-Hernandez A, Morrison SJ, Clarke MF. Prospective identification of tumorigenic breast cancer cells. Proc Natl Acad Sci USA 100: 3983–3988, 2003 - PMC - PubMed
    1. Barker N, van Es JH, Kuipers J, Kujala P, van den Born M, Cozijnsen M, Haegebarth A, Korving J, Begthel H, Peters PJ, Clevers H. Identification of stem cells in small intestine and colon by marker gene Lgr5. Nature 449: 1003–1007, 2007 - PubMed
    1. Bastide P, Darido C, Pannequin J, Kist R, Robine S, Marty-Double C, Bibeau F, Scherer G, Joubert D, Hollande F, Blache P, Jay P. Sox9 regulates cell proliferation and is required for Paneth cell differentiation in the intestinal epithelium. J Cell Biol 178: 635–648, 2007 - PMC - PubMed

Publication types

LinkOut - more resources