. 2010 Mar 1;181(5):465-77.
doi: 10.1164/rccm.200905-0798OC. Epub 2009 Dec 10.

Latent herpesvirus infection augments experimental pulmonary fibrosis

Affiliations

Latent herpesvirus infection augments experimental pulmonary fibrosis

Kevin M Vannella et al. Am J Respir Crit Care Med. .

Abstract

Rationale: No effective treatment exists for idiopathic pulmonary fibrosis, and its pathogenesis remains unclear. Accumulating evidence implicates herpesviruses as cofactors (either initiating or exacerbating agents) of fibrotic lung disease, but a role for latent herpesvirus infection has not been studied.

Objectives: To develop a murine model to determine whether latent herpesvirus infection can augment fibrotic responses and to gain insight into potential mechanisms of enhanced fibrogenesis.

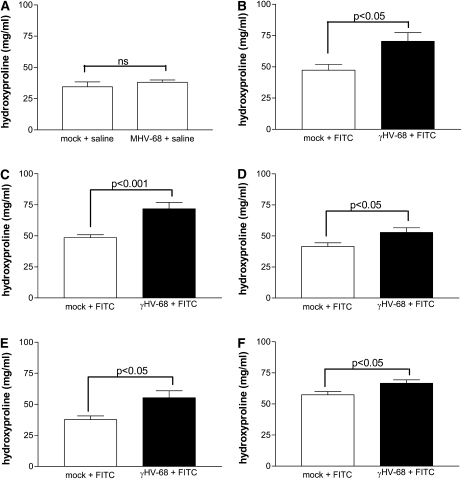
Methods: Mice were infected with murine gammaherpesvirus 14 to 70 days before a fibrotic challenge with fluorescein isothiocyanate or bleomycin so that the virus was latent at the time of fibrotic challenge. Measurements were made after viral infection alone or after the establishment of fibrosis.

Measurements and main results: gammaHerpesvirus is latent by 14 days post infection, and infection 14 to 70 days before fibrotic challenge augmented fibrosis. Fibrotic augmentation was not dependent on reactivation of the latent virus to a lytic state. Total cell numbers and fibrocyte numbers were increased in the lungs of latently infected mice administered fibrotic challenge compared with mock-infected mice that received fibrotic challenge. Latent infection up-regulates expression of proinflammatory chemokines, transforming growth factor-beta1, and cysteinyl leukotrienes in alveolar epithelial cells.

Conclusions: Latent gammaherpesvirus infection augments subsequent fibrotic responses in mice. Enhanced fibrosis is associated with the induction of profibrotic factors and the recruitment of fibrocytes. Our data complement existing human and animal data supporting the hypothesis that gammaherpesviruses can serve as initiating cofactors in the pathogenesis of pulmonary fibrosis.


Figures

Figure 1.
Figure 1.
γHerpesvirus-68 (γHV-68) infection is latent in the lung by 14 days post infection (d.p.i.). Wild-type C57Bl/6 mice were given an intranasal infection with 5 × 10⁴ plaque-forming units of γHV-68. Subsequently, lytic and latent γHV-68 infection was measured in the lungs. Error bars represent SEM between individual mice. (A) Viral plaque assay demonstrates that there is no active viral replication by 14 d.p.i (nd = not detectable, n = 3). (B) Real-time reverse transcriptase–polymerase chain reaction (RT-PCR) demonstrates that gene expression of the lytic viral gene DNApol decreases to nearly undetectable levels from 14 to 70 d.p.i. (n = 5). Viral gene expression 3 d.p.i. was set at 1, and viral gene expression on subsequent days is expressed in comparison for B and C. (C) Real-time RT-PCR demonstrates that gene expression of the latent viral gene M3 is detectable to 70 d.p.i. (n = 5). It should be noted that M3 is also expressed during lytic infection and remains present during early latent infection.
Figure 2.
Figure 2.
Latent γherpesvirus-68 (γHV-68) augments fluorescein isothiocyanate (FITC)-induced pulmonary fibrosis. (A) Wild-type C57Bl/6 mice were inoculated intranasally with 5 × 10⁴ plaque-forming units of γHV-68 or were mock infected with saline on Day 0. Then, at 14 days post infection (d.p.i.), mice of both groups were administered intratracheal saline. Lungs were harvested 21 days after saline intratracheal administration, which is 35 d.p.i. Hydroxyproline assay of the lungs demonstrates that γHV-68 infection alone does not augment collagen levels in the lung compared with lungs of mock-infected mice, n = 4–5. (B) 14, (C) 21, (D) 30, (E) 45, and (F) 70 d.p.i., γHV-68–infected mice and mock-infected mice were administered intratracheal FITC. In each case, lungs were harvested 21 days after FITC administration. Hydroxyproline assays of the harvested lungs demonstrate that γHV-68 infection before FITC at each time point causes a significant augmentation in collagen levels in fibrotic lungs. For B, C, D, and F data were combined from two to three experiments. The n values for the mock+FITC and γHV-68+FITC groups, respectively, are as follows: B, n = 7, 11; C, n = 14, 12; D, n = 10, 9; F, n = 13, 18. E represents a single experiments with n = 5 mice per group.
Figure 3.
Figure 3.
Latent γherpesvirus-68 (γHV-68) augments bleomycin-induced pulmonary fibrosis. Wild-type C57Bl/6 mice were inoculated intranasally with 5 × 10⁴ plaque-forming units of γHV-68 or mock-infected with saline on Day 0. Seventy days post infection, γHV-68–infected mice and mock-infected mice were administered intratracheal bleomycin. Lungs were harvested 21 days after bleomycin administration. Hydroxyproline assays of the harvested lungs demonstrate that γHV-68 infection before bleomycin-induced fibrosis causes a significant augmentation in collagen levels in fibrotic lungs (n = 6 mice per group).
Figure 4.
Figure 4.
γHerpesvirus-68 (γHV-68) latency induces fibrosis even with subthreshold fluorescein isothiocyanate (FITC) stimulus. Wild-type C57Bl/6 mice were inoculated intranasally with 5 × 10⁴ plaque-forming units of γHV-68 or mock-infected with saline on Day 0. (A) Fourteen days post infection (d.p.i.) and (B) 21 d.p.i. mice were administered intratracheal saline or intratracheal FITC. Lungs were harvested 21 days after intratracheal injections. A hydroxyproline assay of the lungs demonstrates that in these experiments, FITC alone (hatched bars) does not significantly augment collagen levels in the lungs compared with mice given saline intratracheally (open bars). Despite this, the lungs of FITC-treated mice infected 14 or 21 days previously with γHV-68 (solid bars) displayed a significant augmentation in collagen levels compared with mock-infected mice treated with FITC (n = 3–11 per group).
Figure 5.
Figure 5.
Fluorescein isothiocyanate (FITC) induces a low-level reactivation of γherpesvirus-68 (γHV-68). Wild-type C57Bl/6 mice were given an intranasal injection with 5 × 10⁴ plaque-forming units of γHV-68 on Day 0. On Day 30, mice were administered intratracheal FITC. The lungs of some mice were harvested on Day 30 before FITC administration, and the expression of γHV-68 genes was measured. The lungs of the remainder of the mice were harvested on Day 37 for analysis of viral gene expression. Real-time reverse transcriptase–polymerase chain reaction demonstrates that levels of gene expression of (A) DNApol and (B) gB are increased 7 days after FITC administration compared with mice that were not administered FITC. Viral gene expression is presented relative to the expression level of a housekeeping gene, β-actin, which was set at 1 for each mouse (n = 4 mice per group). nd = not detectable.
Figure 6.
Figure 6.
Reactivation of γherpesvirus-68 (γHV-68) is not necessary to augment fibrosis. Wild-type C57Bl/6 mice were inoculated intranasally with 5 × 10⁴ plaque-forming units (PFU) of ΔORF72, 5 × 10⁴ PFU of a v-cyclin marker-rescue virus (“MR”), or were mock-infected with saline on Day 0. At 14 or 21 days post infection, all of the mice were administered intratracheal fluorescein isothiocyanate (FITC). Lungs were harvested 21 days after the intratracheal injection and lung hydroxyproline content was assayed. There was no significant difference between fibrosis in mice infected with either the ΔORF72 or the “MR” virus 21 or 14 days before the administration of FITC (n = 5–6 mice per group). i.n. = intranasal.
Figure 7.
Figure 7.
Latent γherpesvirus-68 (γHV-68) augments inflammation in the lung during fluorescein isothiocyanate (FITC)-induced pulmonary fibrosis. (A and B) Wild-type C57Bl/6 mice were infected intranasally with 5 × 10⁴ plaque-forming units of γHV-68 or were mock infected on Day 0. Then 17 days post infection, latently infected mice and mock-infected mice were administered intratracheal saline or FITC. Lungs were harvested and digested (A) 7 days or (B) 21 days after FITC administration, and total cells were enumerated. The lungs of mice treated with γHV-68+FITC (solid bar) display a significant increase in the accumulation of inflammatory cells compared with the lungs of mock-infected mice treated with FITC (hatched bar) (A) 7 days or (B) 21 days after FITC administration (n = 3–5). (CF) Lung sections of mice treated as above and stained with hematoxylin and eosin. For simplicity, the treatment groups are referred to as saline (mock infection i.n. followed by saline i.t.), FITC (mock infection i.n. followed by FITC i.t.), γHV-68 (viral infection i.n. followed by saline i.t.), and γHV-68+FITC (viral infection i.n. followed by FITC i.t.).
Figure 8.
Figure 8.
Latent γherpesvirus-68 (γHV-68) augments fibrocyte accumulation in the lung during fluorescein isothiocyanate (FITC)-induced pulmonary fibrosis. Wild-type C57Bl/6 mice were infected intranasally with 5 × 10⁴ plaque-forming units of γHV-68 or were mock infected on Day 0. At 17 days post infection (d.p.i.), latently infected mice and mock-infected mice were administered intratracheal FITC. Lungs were harvested and digested with collagenase 7 or 21 days after FITC administration, and total cells from the digest were enumerated and stained for CD45 and collagen 1. Flow cytometry was used to determine the percentage of fibrocytes. (A) Flow cytometric analysis of cells from the lung digest of one mouse 30 d.p.i (representative of analysis at each time point post infection). In the left panel, CD45+ cells were gated. In the middle panel, those CD45+ cells were gated to exclude dead cells. In the right panel, living CD45+ collagen 1+ cells were gated. (B) An equal number of cells from each lung digest were stained with a rabbit isotype control antibody instead of the rabbit collagen 1 antibody. To account for nonspecific binding, the percent of cells staining with the isotype control was set to approximately 0.5%. The shape of the gate was chosen to account for autofluorescence. The percentage of fibrocytes was calculated by subtracting the percentage of cells in the irrelevant control (B) from the specific collagen 1 staining percentage (A). Total cells were then calculated by multiplying this percentage by the total number of leukocytes recovered. (CD) The lungs of mice previously infected with γHV-68 (solid bar) have a significant increase in the accumulation of fibrocytes compared with the lungs of mock-infected mice (open bar) (C) 7 days and (D) 21 days after FITC administration (n = 3–5).
Figure 9.
Figure 9.
Viral infection induces fibrocyte accumulation in the lungs for at least 45 days post infection (d.p.i.). Wild-type C57Bl/6 mice were infected intranasally with 5 × 10⁴ plaque-forming units. The lungs of uninfected mice were harvested on Day 0 as controls, and the lungs of virally infected mice were harvested 7, 15, 30, 45, and 70 d.p.i. All lungs were digested with collagenase, and fibrocytes were enumerated as described for Figure 8. Fibrocytes accumulated to significantly higher levels in the lung 15, 30, and 45 d.p.i. compared with uninfected mice (n = 4 mice per group; *P < 0.05, **P < 0.01 compared with uninfected).
Figure 10.
Figure 10.
Chemokine CCL2 and CCL12 levels are increased in the lungs beyond the clearance of lytic γherpesvirus-68 (γHV-68). Wild-type C57Bl/6 mice were infected intranasally with 5 × 10⁴ plaque-forming units of γHV-68 on Day 0 or were left untreated. The lungs of γHV-68–infected mice were harvested 15, 24, and 38 days post infection (d.p.i.) (solid bars) along with lungs of untreated mice (open bar) and lung homogenates were assayed by ELISA for levels of (AC) CCL2 and (EG) CCL12. The lungs of mice latently infected with γHV-68 have significantly higher levels of CCL2 and CCL12 compared with the lungs of uninfected mice (n = 3–10 mice per group; **P < 0.01, ****P < 0.0001 compared with uninfected). In D and H, mice were left uninfected or were infected with γHV-68 on Day 0. Then at 17 d.p.i., mice were given an intratracheal instillation of fluorescein isothiocyanate (FITC) or saline. Lungs were harvested 7 days later (on Day 24) and lung homogenates were analyzed for (D) CCL2 and (H) CCL12; n = 7–10 per group; **P < 0.01, ***P < 0.001 compared with uninfected.
Figure 11.
Figure 11.
Airway alveolar cells (AECs) are latently infected at least 21 days after intranasal infection with γherpesvirus-68 (γHV-68). Wild-type C57Bl/6 mice were infected intranasally with 5 × 10⁴ plaque-forming units of γHV-68 or were mock infected on Day 0. AECs were purified from the lungs of the infected mice 14 and 21 days post infection for analysis of viral gene expression. Real-time reverse transcriptase–polymerase chain reaction demonstrates that viral genes M3 and gB are expressed in the AECs of mice given γHV-68 intranasally Neither M3 nor gB gene expression was detectable in the AECs of mock-infected mice. Viral gene expression is presented relative to the expression level of a housekeeping gene, β-actin, which was set at 1 for each mouse (n = 3–8 mice per group). i.n. = intranasal; nd = not detectable.
Figure 12.
Figure 12.
Latently infected alveolar epithelial cells (AECs) express higher levels of chemokines CCL2 and CCL12. Wild-type C57Bl/6 mice were infected intranasally with 5 × 10⁴ plaque-forming units of γherpesvirus-68 (γHV-68) or were mock infected on Day 0. AECs were purified from the lungs of the infected mice 14 and 21 days post infection (d.p.i.) for analysis of chemokine gene expression. Real-time reverse transcriptase–polymerase chain reaction demonstrates that (A) CCL2 gene expression is significantly increased in AECs harvested 21 d.p.i., whereas (B) CCL12 gene expression is significantly increased in AECs harvested 14 or 21 d.p.i. (n = 3–8 mice per group; *P < 0.05, ***P < 0.001 compared with mock infected). i.n. = intranasal.
Figure 13.
Figure 13.
γHerpesvirus-68 (γHV-68) infection induces TGF-β1 production. Alveolar epithelial cells (AECs) from latently infected mice produce more total TGF-β1 than AECs from mock-infected mice. Wild-type C57Bl/6 mice were infected intranasally with 5 × 10⁴ plaque-forming units γHV-68 or were mock infected with saline, and AECs were purified from the lungs of both groups 14 days post infection. AECs were then cultured for 24 hours, and the culture supernatants were assayed for total TGF-β1 by ELISA. TGF-β1 from AECs of latently infected mice is represented by the solid bar, and TGF-β1 from AECs of mock-infected mice is represented by the open bar (n = 4–6 per group). (B) Lung epithelial cells infected with γHV-68 in vitro produce more active TGF-β1 than uninfected lung epithelial cells. The bar graph shown reflects the results of a luciferase assay used to measure active TGF-β1 production from epithelial cells in culture for 3 or 7 days. The cells were either uninfected or infected at a multiplicity of infection of 0.005 or 0.05. Active TGF-β1 produced is presented relative to amount of active TGF-β1 produced by uninfected cells after 3 days in culture, which was set at 1 (n = 6–8 mice per group; ***P < 0.001 compared with uninfected cells from same time point). i.n. = intranasal; MOI = multiplicity of infection.
Figure 14.
Figure 14.
Latent γherpesvirus-68 (γHV-68) infection induces cysteinyl leukotriene (cysLT) production in alveolar epithelial cells (AECs). Wild-type C57Bl/6 mice were infected intranasally with 5 × 10⁴ plaque-forming units of γHV-68 or mock infected with saline, and AECs were purified from the lungs 14 days post infection. AECs (A) were cultured for 24 hours in serum-free media without A23187 or (B) were cultured for 24 hours with A23187 (5 μM). The culture supernatants were then assayed for cysLTs by ELISA. CysLTs from AECs of latently infected mice are represented by the solid bars, and cysLTs from AECs of mock-infected mice are represented by the open bars (n = 3 per group). i.n. = intranasal.
Figure 15.
Figure 15.
Hypothesized focal changes induced by latently infected alveolar epithelial cells (AECs) that promote fibrosis. Schematic shows changes in the lung microenvironment around a latently infected AEC that are hypothesized on the basis of our data. Future experiments are necessary to fully confirm this hypothesis. TGF = transforming growth factor.

Similar articles

Cited by

References

    1. American Thoracic Society. Idiopathic pulmonary fibrosis: diagnosis and treatment. International consensus statement. American Thoracic Society (ATS), and the European Respiratory Society (ERS). Am J Respir Crit Care Med 2000;161:646–664. - PubMed
    1. Lok SS, Stewart JP, Kelly BG, Hasleton PS, Egan JJ. Epstein-Barr virus and wild p53 in idiopathic pulmonary fibrosis. Respir Med 2001;95:787–791. - PubMed
    1. Tang YW, Johnson JE, Browning PJ, Cruz-Gervis RA, Davis A, Graham BS, Brigham KL, Oates JA Jr, Loyd JE, Stecenko AA. Herpesvirus DNA is consistently detected in lungs of patients with idiopathic pulmonary fibrosis. J Clin Microbiol 2003;41:2633–2640. - PMC - PubMed
    1. Kelly BG, Lok SS, Hasleton PS, Egan JJ, Stewart JP. A rearranged form of Epstein-Barr virus DNA is associated with idiopathic pulmonary fibrosis. Am J Respir Crit Care Med 2002;166:510–513. - PubMed
    1. Stewart JP, Egan JJ, Ross AJ, Kelly BG, Lok SS, Hasleton PS, Woodcock AA. The detection of Epstein-Barr virus DNA in lung tissue from patients with idiopathic pulmonary fibrosis. Am J Respir Crit Care Med 1999;159:1336–1341. - PubMed

Publication types

MeSH terms

Substances