

Increased hypothalamic signal transducer and activator of transcription 3 phosphorylation after hindbrain leptin injection
- PMID: 20185769
- PMCID: PMC2850241
- DOI: 10.1210/en.2009-0854
Increased hypothalamic signal transducer and activator of transcription 3 phosphorylation after hindbrain leptin injection
Abstract
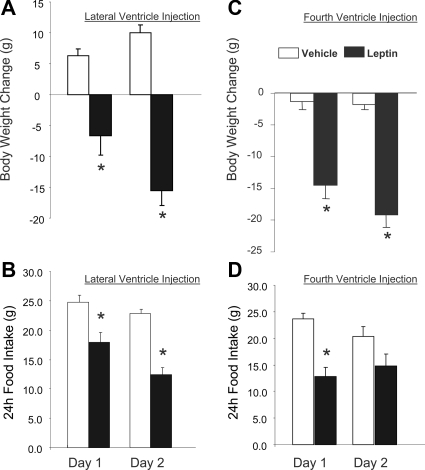
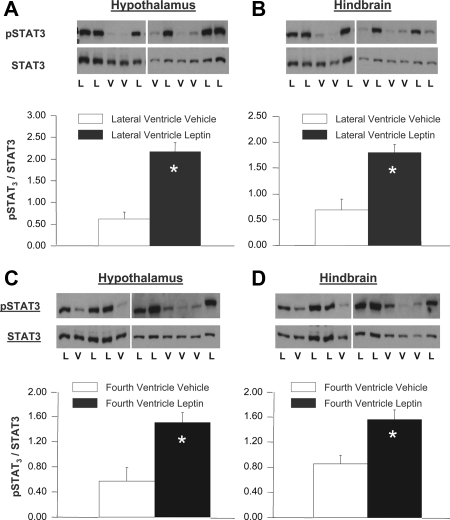
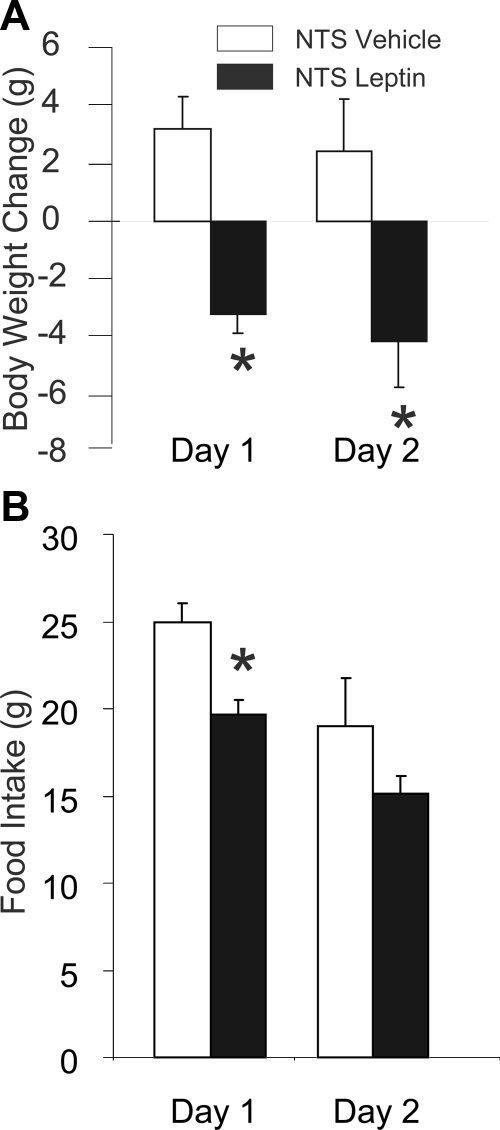
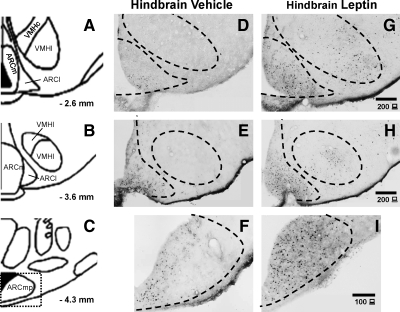
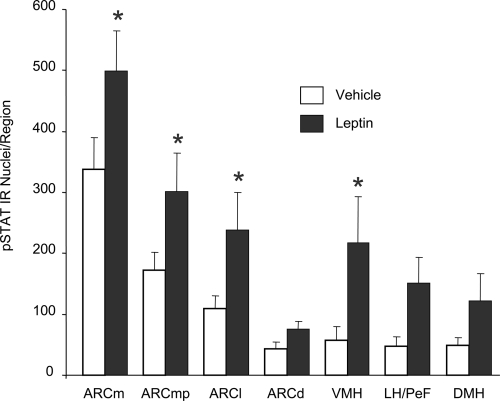
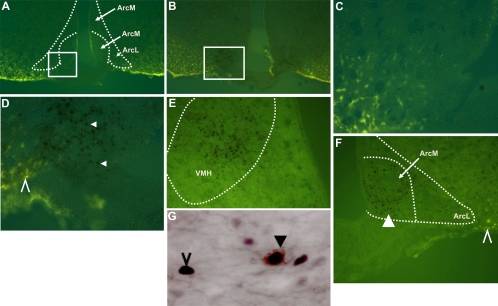
Reduction of food intake and body weight by leptin is attributed largely to its action in the hypothalamus. However, the signaling splice variant of the leptin receptor, LRb, also is expressed in the hindbrain, and leptin injections into the fourth cerebral ventricle or dorsal vagal complex are associated with reductions of feeding and body weight comparable to those induced by forebrain leptin administration. Although these observations suggest direct hindbrain action of leptin on feeding and body weight, the possibility that hindbrain leptin administration also activates the Janus kinase/signal transducer and activator of transcription 3 (STAT3) signaling in the hypothalamus has not been investigated. Confirming earlier work, we found that leptin produced comparable reductions of feeding and body weight when injected into the lateral ventricle or the fourth ventricle. We also found that lateral and fourth ventricle leptin injections produced comparable increases of STAT3 phosphorylation in both the hindbrain and the hypothalamus. Moreover, injection of 50 ng of leptin directly into the nucleus of the solitary tract also increased STAT3 phosphorylation in the hypothalamic arcuate and ventromedial nuclei. Increased hypothalamic STAT3 phosphorylation was not due to elevation of blood leptin concentrations and the pattern of STAT3 phosphorylation did not overlap distribution of the retrograde tracer, fluorogold, injected via the same cannula. Our observations indicate that even small leptin doses administered to the hindbrain can trigger leptin-related signaling in the forebrain, and raise the possibility that STAT3 phosphorylation in the hypothalamus may contribute to behavioral and metabolic changes observed after hindbrain leptin injections.
Figures
Similar articles
-
Fourth-ventricle leptin infusions dose-dependently activate hypothalamic signal transducer and activator of transcription 3.Am J Physiol Endocrinol Metab. 2016 Dec 1;311(6):E939-E948. doi: 10.1152/ajpendo.00343.2016. Epub 2016 Nov 1. Am J Physiol Endocrinol Metab. 2016. PMID: 27802966 Free PMC article.
-
Leptin in the hindbrain facilitates phosphorylation of STAT3 in the hypothalamus.Am J Physiol Endocrinol Metab. 2015 Mar 1;308(5):E351-61. doi: 10.1152/ajpendo.00501.2014. Epub 2014 Dec 30. Am J Physiol Endocrinol Metab. 2015. PMID: 25550283 Free PMC article.
-
Systemic leptin dose-dependently increases STAT3 phosphorylation within hypothalamic and hindbrain nuclei.Am J Physiol Regul Integr Comp Physiol. 2014 Apr 15;306(8):R576-85. doi: 10.1152/ajpregu.00017.2014. Epub 2014 Feb 12. Am J Physiol Regul Integr Comp Physiol. 2014. PMID: 24523344 Free PMC article.
-
Hormonal induction of leptin resistance during pregnancy.Physiol Behav. 2007 Jul 24;91(4):366-74. doi: 10.1016/j.physbeh.2007.04.005. Epub 2007 Apr 12. Physiol Behav. 2007. PMID: 17555777 Review.
-
Hindbrain circuits in the control of eating behaviour and energy balance.Nat Metab. 2022 Jul;4(7):826-835. doi: 10.1038/s42255-022-00606-9. Epub 2022 Jul 25. Nat Metab. 2022. PMID: 35879458 Review.
Cited by
-
Food intake reductions and increases in energetic responses by hindbrain leptin and melanotan II are enhanced in mice with POMC-specific PTP1B deficiency.Am J Physiol Endocrinol Metab. 2012 Sep 1;303(5):E644-51. doi: 10.1152/ajpendo.00009.2012. Epub 2012 Jul 3. Am J Physiol Endocrinol Metab. 2012. PMID: 22761160 Free PMC article.
-
Fourth-ventricle leptin infusions dose-dependently activate hypothalamic signal transducer and activator of transcription 3.Am J Physiol Endocrinol Metab. 2016 Dec 1;311(6):E939-E948. doi: 10.1152/ajpendo.00343.2016. Epub 2016 Nov 1. Am J Physiol Endocrinol Metab. 2016. PMID: 27802966 Free PMC article.
-
Synergistic interaction between leptin and cholecystokinin in the rat nodose ganglia is mediated by PI3K and STAT3 signaling pathways: implications for leptin as a regulator of short term satiety.J Biol Chem. 2011 Apr 1;286(13):11707-15. doi: 10.1074/jbc.M110.198945. Epub 2011 Jan 26. J Biol Chem. 2011. PMID: 21270124 Free PMC article.
-
Leptin overexpression in VTA trans-activates the hypothalamus whereas prolonged leptin action in either region cross-desensitizes.Neuropharmacology. 2013 Feb;65:90-100. doi: 10.1016/j.neuropharm.2012.09.005. Epub 2012 Sep 13. Neuropharmacology. 2013. PMID: 22982569 Free PMC article.
-
Evaluating the potential for rostral diffusion in the cerebral ventricles using angiotensin II-induced drinking in rats.Brain Res. 2012 Nov 27;1486:62-7. doi: 10.1016/j.brainres.2012.09.040. Epub 2012 Sep 28. Brain Res. 2012. PMID: 23026079 Free PMC article.
References
-
- Green ED, Maffei M, Braden VV, Proenca R, DeSilva U, Zhang Y, Chua Jr SC, Leibel RL, Weissenbach J, Friedman JM 1995 The human obese (OB) gene: RNA expression pattern and mapping on the physical, cytogenetic, and genetic maps of chromosome 7. Genome Res 5:5–12 - PubMed
-
- Zhang Y, Proenca R, Maffei M, Barone M, Leopold L, Friedman JM 1994 Positional cloning of the mouse obese gene and its human homologue. Nature 372:425–432 - PubMed
-
- Campfield LA, Smith FJ, Guisez Y, Devos R, Burn P 1995 Recombinant mouse OB protein: evidence for a peripheral signal linking adiposity and central neural networks. Science 269:546–549 - PubMed
-
- Halaas JL, Gajiwala KS, Maffei M, Cohen SL, Chait BT, Rabinowitz D, Lallone RL, Burley SK, Friedman JM 1995 Weight-reducing effects of the plasma protein encoded by the obese gene. Science 269:543–546 - PubMed
Publication types
MeSH terms
Substances
Grants and funding
LinkOut - more resources
Full Text Sources
Miscellaneous
