. 2010 May;59(5):1228-38.
doi: 10.2337/db09-0519. Epub 2010 Feb 25.

Glucose intolerance and reduced proliferation of pancreatic beta-cells in transgenic pigs with impaired glucose-dependent insulinotropic polypeptide function

Affiliations

Glucose intolerance and reduced proliferation of pancreatic beta-cells in transgenic pigs with impaired glucose-dependent insulinotropic polypeptide function

Simone Renner et al. Diabetes. 2010 May.

Abstract

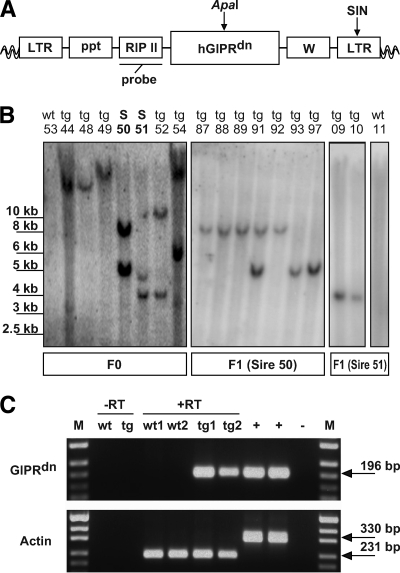
Objective: The insulinotropic action of the incretin glucose-dependent insulinotropic polypeptide (GIP) is impaired in type 2 diabetes, while the effect of glucagon-like peptide-1 (GLP-1) is preserved. To evaluate the role of impaired GIP function in glucose homeostasis and development of the endocrine pancreas in a large animal model, we generated transgenic pigs expressing a dominant-negative GIP receptor (GIPR(dn)) in pancreatic islets.

Research design and methods: GIPR(dn) transgenic pigs were generated using lentiviral transgenesis. Metabolic tests and quantitative stereological analyses of the different endocrine islet cell populations were performed, and beta-cell proliferation and apoptosis were quantified to characterize this novel animal model.

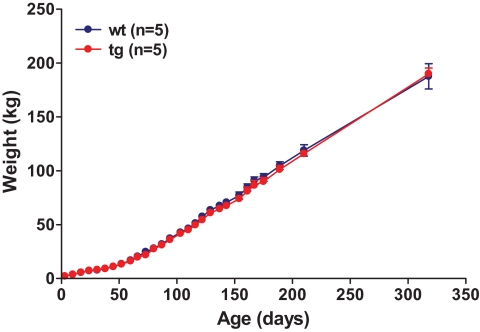
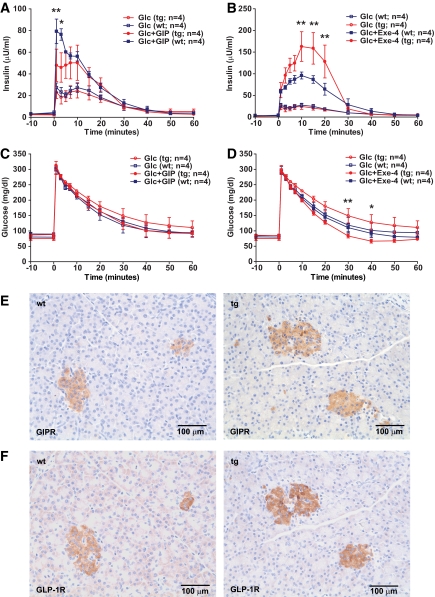
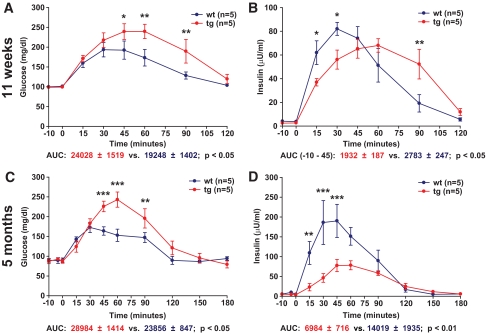
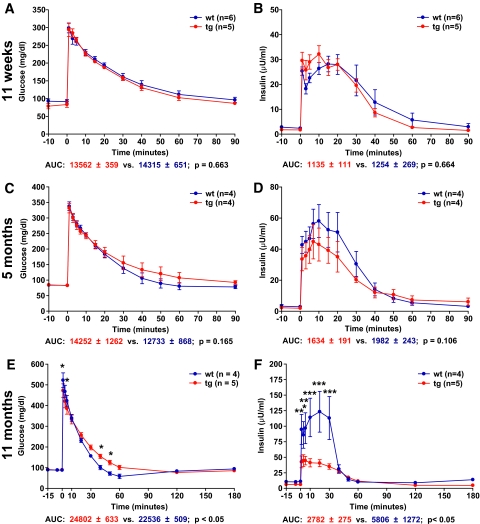
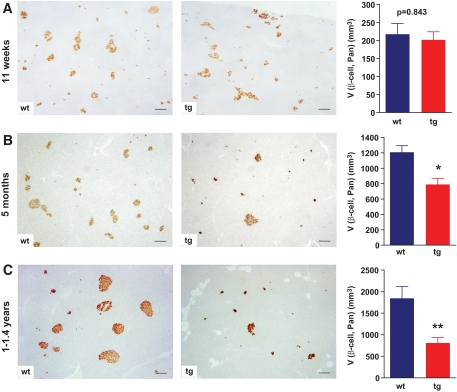
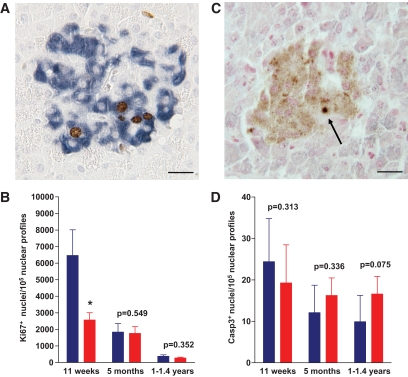
Results: Eleven-week-old GIPR(dn) transgenic pigs exhibited significantly reduced oral glucose tolerance due to delayed insulin secretion, whereas intravenous glucose tolerance and pancreatic beta-cell mass were not different from controls. The insulinotropic effect of GIP was significantly reduced, whereas insulin secretion in response to the GLP-1 receptor agonist exendin-4 was enhanced in GIPR(dn) transgenic versus control pigs. With increasing age, glucose control deteriorated in GIPR(dn) transgenic pigs, as shown by reduced oral and intravenous glucose tolerance due to impaired insulin secretion. Importantly, beta-cell proliferation was reduced by 60% in 11-week-old GIPR(dn) transgenic pigs, leading to a reduction of beta-cell mass by 35% and 58% in 5-month-old and 1- to 1.4-year-old transgenic pigs compared with age-matched controls, respectively.

Conclusions: The first large animal model with impaired incretin function demonstrates an essential role of GIP for insulin secretion, proliferation of beta-cells, and physiological expansion of beta-cell mass.


Figures

FIG. 1.
FIG. 1.
Lentiviral vector, Southern blot analyses, and transgene expression. A: The lentiviral vector (LV-GIPRdn) carrying the cDNA of the dominant-negative GIPR (GIPRdn) under the control of the rat Ins2 gene promoter (RIP II). ApaI, restriction site of ApaI; LTR, long terminal repeat; ppt, polypurine tract; SIN, self-inactivating mutation; W, woodchuck hepatitis posttranscriptional regulatory element; probe, probe used for Southern blot analyses; wavy lines, pig genome. B: Southern blot analyses of ApaI-digested genomic DNA isolated from EDTA blood of piglets generated by subzonal injection of LV-GIPRdn (transgenic [tg]) and two nontransgenic littermates (wild type [wt]). Pigs of the F0 generation show either one or two single-copy integration sites of the transgene. Sires 50 and 51 (S 50/S 51) were selected to establish two transgenic lines. Note that pigs of the F1 generation show segregation of the integrants according to the Mendelian rules. C: Analysis of transgene expression (GIPRdn) in isolated porcine islets of Langerhans of transgenic (tg) and nontransgenic littermates (wt) by RT-PCR. β-Actin RT-PCR used for confirmation of reverse transcription efficiency. Due to the use of intron-spanning primers to detect β-actin, two different-sized bands are visible differentiating cDNA and genomic DNA. M: pUC Mix Marker; −RT wt: minus RT wild-type pigs; −RT tg: minus RT GIPRdn transgenic pigs (no signals were obtained from islets of transgenic offspring after omission of the RT step, demonstrating that expressed rather than integrated sequences were detected); +, genomic DNA of GIPRdn transgenic pig; −, aqua bidest.
FIG. 2.
FIG. 2.
Body weight gain of GIPRdn transgenic pigs (tg) compared with control pigs (wt). Data are means ± SE. (A high-quality digital representation of this figure is available in the online issue.)
FIG. 3.
FIG. 3.
Functional analysis of GIPRdn expression by GIP/exendin-4 stimulation test. Reduced insulinotropic action of GIP but enhanced insulinotropic action of exendin-4 in 11-week-old GIPRdn transgenic pigs (tg) compared with nontransgenic control animals (wt). A: Serum insulin levels of GIPRdn transgenic (tg) and control (wt) pigs after intravenous administration of glucose (Glc) ± GIP. B: Serum insulin levels of GIPRdn transgenic (tg) and control (wt) pigs after intravenous administration of glucose (Glc) ± exendin-4 (Exe-4). C and D: Corresponding serum glucose levels for the GIP (C) and exendin-4 (D) stimulation test. 0 min = point of Glc/GIP/exendin-4 administration. Data are means ± SE. *P < 0.05 vs. control; **P < 0.01 vs. control. E and F: Immunohistochemical staining of GIPR (E) and GLP-1R (F) in pancreas sections from 11-week-old GIPRdn transgenic pigs (tg) and nontransgenic control animals (wt) does not provide evidence for differences in receptor abundance. (A high-quality digital representation of this figure is available in the online issue.)
FIG. 4.
FIG. 4.
Oral glucose tolerance in 11-week-old and 5-month-old GIPRdn transgenic pigs (tg) compared with nontransgenic littermates (wt). A and C: Serum glucose levels; 0 min = point of glucose administration. B and D: Serum insulin levels. AUC glucose/insulin for transgenic pigs (red) and wild-type pigs (blue). Data are means ± SE. *P < 0.05 vs. control; **P < 0.01 vs. control; ***P < 0.001 vs. control. Note that in 11-week-old transgenic pigs, there is a delay in insulin secretion leading to a significant reduction of insulin secretion during the first 45 min following oral glucose load, although the total amount of insulin secreted over 120 min is not different from controls. In contrast, 5-month-old transgenic pigs display not only delayed but also reduced insulin secretion. A high-quality digital representation of this figure is available in the online issue.
FIG. 5.
FIG. 5.
Intravenous glucose tolerance in GIPRdn transgenic pigs (tg) compared with nontransgenic controls (wt). A, C, and E: Serum glucose levels; 0 min = point of glucose administration. B, D, and F: Serum insulin levels. AUC glucose/insulin for transgenic pigs (red) and wild-type pigs (blue). Data are means ± SE. *P < 0.05 vs. control; **P < 0.01 vs. control; ***P < 0.001 vs. control. Note that intravenous glucose tolerance (A) and insulin secretion (B) are not altered in 11-week-old transgenic pigs. In 5-month-old transgenic pigs, a tendency of reduced insulin secretion (D) is observed, while 11-month-old transgenic pigs display a significantly reduced intravenous glucose tolerance (E) due to a significantly reduced insulin secretion (F). (A high-quality digital representation of this figure is available in the online issue.)
FIG. 6.
FIG. 6.
Immunohistochemistry for insulin and total β-cell volume in the pancreas [V(β-cell, Pan)] determined with quantitative stereological methods. A–C: Representative histological sections of pancreatic tissue from a control (wt) and a GIPRdn transgenic pig (tg); scale bar = 200 μm. Unaltered total β-cell volume in 11-week-old GIPRdn transgenic pigs (n = 5 per group) (A) but reduction of the total β-cell volume in 5-month-old (n = 4 per group) (B) and young adult (1–1.4 years old) (n = 5 per group) GIPRdn transgenic pigs (C) compared with controls. Data are means ± SE. *P < 0.05 vs. control; **P < 0.01 vs. control. A high-quality digital representation of this figure is available in the online issue.
FIG. 7.
FIG. 7.
β-Cell proliferation and apoptosis. A and C: Representative histological sections doublestained for insulin (blue) and Ki67 (brown) (A) or for insulin (light brown) plus cleaved caspase-3 (dark blue; see arrow) (C). B and D: Determination of the number of Ki67− (B) and cleaved caspase-3–positive β-cells (D). Wild type: blue bars, transgenic: red bars. Wild type: n = 5, transgenic: n = 5 for 11-week-old and 1- to 1.4-year-old pigs; wild type: n = 4, transgenic: n = 4 for 5-month-old pigs. Data are means ± SE. *P < 0.05 vs. control; scale bar = 20 μm. Note the significantly (P < 0.05) reduced β-cell proliferation rate in 11-week-old GIPRdn transgenic pigs. (A high-quality digital representation of this figure is available in the online issue.)

References

    1. Baggio LL, Drucker DJ. Biology of incretins: GLP-1 and GIP. Gastroenterology 2007;132:2131–2157 - PubMed
    1. Mayo KE, Miller LJ, Bataille D, Dalle S, Goke B, Thorens B, Drucker DJ. International Union of Pharmacology. XXXV. The glucagon receptor family. Pharmacol Rev 2003;55:167–194 - PubMed
    1. Holst JJ, Gromada J. Role of incretin hormones in the regulation of insulin secretion in diabetic and nondiabetic humans. Am J Physiol Endocrinol Metab 2004;287:E199–E206 - PubMed
    1. Saxena R, Hivert MF, Langenberg C, Tanaka T, Pankow JS, Vollenweider P, Lyssenko V, Bouatia-Naji N, Dupuis J, Jackson AU, Kao WH, Li M, Glazer NL, Manning AK, Luan J, Stringham HM, Prokopenko I, Johnson T, Grarup N, Boesgaard TW, Lecoeur C, Shrader P, O'Connell J, Ingelsson E, Couper DJ, Rice K, Song K, Andreasen CH, Dina C, Kottgen A, Le Bacquer O, Pattou F, Taneera J, Steinthorsdottir V, Rybin D, Ardlie K, Sampson M, Qi L, van Hoek M, Weedon MN, Aulchenko YS, Voight BF, Grallert H, Balkau B, Bergman RN, Bielinski SJ, Bonnefond A, Bonnycastle LL, Borch-Johnsen K, Bottcher Y, Brunner E, Buchanan TA, Bumpstead SJ, Cavalcanti-Proenca C, Charpentier G, Chen YD, Chines PS, Collins FS, Cornelis M, G JC, Delplanque J, Doney A, Egan JM, Erdos MR, Firmann M, Forouhi NG, Fox CS, Goodarzi MO, Graessler J, Hingorani A, Isomaa B, Jorgensen T, Kivimaki M, Kovacs P, Krohn K, Kumari M, Lauritzen T, Levy-Marchal C, Mayor V, McAteer JB, Meyre D, Mitchell BD, Mohlke KL, Morken MA, Narisu N, Palmer CN, Pakyz R, Pascoe L, Payne F, Pearson D, Rathmann W, Sandbaek A, Sayer AA, Scott LJ, Sharp SJ, Sijbrands E, Singleton A, Siscovick DS, Smith NL, Sparso T, Swift AJ, Syddall H, Thorleifsson G, Tonjes A, Tuomi T, Tuomilehto J, Valle TT, Waeber G, Walley A, Waterworth DM, Zeggini E, Zhao JH, Illig T, Wichmann HE, Wilson JF, van Duijn C, Hu FB, Morris AD, Frayling TM, Hattersley AT, Thorsteinsdottir U, Stefansson K, Nilsson P, Syvanen AC, Shuldiner AR, Walker M, Bornstein SR, Schwarz P, Williams GH, Nathan DM, Kuusisto J, Laakso M, Cooper C, Marmot M, Ferrucci L, Mooser V, Stumvoll M, Loos RJ, Altshuler D, Psaty BM, Rotter JI, Boerwinkle E, Hansen T, Pedersen O, Florez JC, McCarthy MI, Boehnke M, Barroso I, Sladek R, Froguel P, Meigs JB, Groop L, Wareham NJ, Watanabe RM: Genetic variation in GIPR influences the glucose and insulin responses to an oral glucose challenge. Nat Genet 2010;42:142–148 - PMC - PubMed
    1. Ehses JA, Casilla VR, Doty T, Pospisilik JA, Winter KD, Demuth HU, Pederson RA, McIntosh CH. Glucose-dependent insulinotropic polypeptide promotes beta-(INS-1) cell survival via cyclic adenosine monophosphate-mediated caspase-3 inhibition and regulation of p38 mitogen-activated protein kinase. Endocrinology 2003;144:4433–4445 - PubMed

Publication types

LinkOut - more resources