Hedgehog signaling in pancreas epithelium regulates embryonic organ formation and adult beta-cell function
- PMID: 20185815
- PMCID: PMC2857901
- DOI: 10.2337/db09-0914
Hedgehog signaling in pancreas epithelium regulates embryonic organ formation and adult beta-cell function
Abstract
Objective: Current studies indicate that Hedgehog (Hh) signaling must be excluded during early stages of pancreas formation. However, conflicting evidence suggests that Hh signaling may be active later during pancreas formation and that it is required for insulin production and secretion in cultured beta-cell lines. The objective of this study was to address these discrepancies by assessing the in vivo role of epithelial Hh signaling in the pancreas.
Research design and methods: To identify Hh-active cells in the developing and adult pancreas epithelium, we characterized transgenic reporter Patched1-LacZ mice. To determine the requirement for epithelial Hh signaling in the pancreas, we eliminated an essential Hh signaling component, Smoothened (Smo), in the pancreatic epithelium, and assessed pancreatic development and adult beta-cell physiology phenotypes.
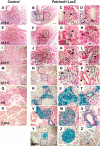
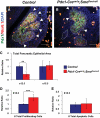
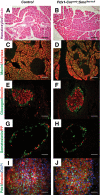
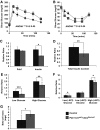
Results: Characterization of Patched1-LacZ reporter mice revealed low-level LacZ expression in pancreatic epithelial cells throughout development until birth, when LacZ activity increases in intensity specifically in endocrine and ductal cells. In the absence of Hh signaling, Smo-deficient mice have delayed pancreas formation leading to a temporary reduction in pancreatic epithelium and beta-cell numbers. Although beta-cell numbers recover by birth, adult Smo-deficient mice display glucose intolerance, increased insulin sensitivity, and reduced total insulin production.
Conclusions: These data show that Hh signaling functions early during pancreas morphogenesis to regulate epithelial and beta-cell expansion and to modulate glucose metabolism by regulating insulin production in adult mice.
Figures


Similar articles
-
Hedgehog-signaling is upregulated in non-producing human adrenal adenomas and antagonism of hedgehog-signaling inhibits proliferation of NCI-H295R cells and an immortalized primary human adrenal cell line.J Steroid Biochem Mol Biol. 2014 Jan;139:7-15. doi: 10.1016/j.jsbmb.2013.09.007. Epub 2013 Sep 21. J Steroid Biochem Mol Biol. 2014. PMID: 24063979
-
Characterization of primary cilia and Hedgehog signaling during development of the human pancreas and in human pancreatic duct cancer cell lines.Dev Dyn. 2008 Aug;237(8):2039-52. doi: 10.1002/dvdy.21610. Dev Dyn. 2008. PMID: 18629868
-
Ectopic overexpression of Sonic Hedgehog (Shh) induces stromal expansion and metaplasia in the adult murine pancreas.Neoplasia. 2011 Oct;13(10):923-30. doi: 10.1593/neo.11088. Neoplasia. 2011. PMID: 22028618 Free PMC article.
-
Interaction of hedgehog and vitamin D signaling pathways in basal cell carcinomas.Adv Exp Med Biol. 2014;810:329-41. doi: 10.1007/978-1-4939-0437-2_18. Adv Exp Med Biol. 2014. PMID: 25207374 Review.
-
The interplay of Patched, Smoothened and cholesterol in Hedgehog signaling.Curr Opin Cell Biol. 2019 Dec;61:31-38. doi: 10.1016/j.ceb.2019.06.008. Epub 2019 Jul 29. Curr Opin Cell Biol. 2019. PMID: 31369952 Review.
Cited by
-
Genome-wide association study identifies QTLs for displacement of abomasum in Chinese Holstein cattle1.J Anim Sci. 2019 Mar 1;97(3):1133-1142. doi: 10.1093/jas/skz031. J Anim Sci. 2019. PMID: 30715382 Free PMC article.
-
Gli-similar proteins: their mechanisms of action, physiological functions, and roles in disease.Vitam Horm. 2012;88:141-71. doi: 10.1016/B978-0-12-394622-5.00007-9. Vitam Horm. 2012. PMID: 22391303 Free PMC article. Review.
-
Stage-specific transcriptomic changes in pancreatic α-cells after massive β-cell loss.BMC Genomics. 2021 Aug 2;22(1):585. doi: 10.1186/s12864-021-07812-x. BMC Genomics. 2021. PMID: 34340653 Free PMC article.
-
Canonical and non-canonical Hedgehog signalling and the control of metabolism.Semin Cell Dev Biol. 2014 Sep;33:81-92. doi: 10.1016/j.semcdb.2014.05.007. Epub 2014 May 23. Semin Cell Dev Biol. 2014. PMID: 24862854 Free PMC article. Review.
-
Primary Cilia in Pancreatic β- and α-Cells: Time to Revisit the Role of Insulin-Degrading Enzyme.Front Endocrinol (Lausanne). 2022 Jun 27;13:922825. doi: 10.3389/fendo.2022.922825. eCollection 2022. Front Endocrinol (Lausanne). 2022. PMID: 35832432 Free PMC article. Review.
References
-
- Pictet R, Rutter WJ. Development of the embryonic endocrine pancreas. In Handbook of Physiology Greep RO, Astwood EB, Steiner DF, Freinkel N, Geiger SR. Eds. Washington, DC, American Physiological Society, 1972, p. 25–76
-
- Gittes GK, Galante PE, Hanahan D, Rutter WJ, Debase HT. Lineage-specific morphogenesis in the developing pancreas: role of mesenchymal factors. Development 1996;122:439–447 - PubMed
-
- Gittes GK. Developmental biology of the pancreas: a comprehensive review. Dev Biol 2009;326:4–35 - PubMed
-
- Varjosalo M, Taipale J. Hedgehog: functions and mechanisms. Genes Dev 2008;22:2454–2472 - PubMed
-
- Ingham PW, McMahon AP. Hedgehog signaling in animal development: paradigms and principles. Genes Dev 2001;15:3059–3087 - PubMed
Publication types
MeSH terms
Substances
Grants and funding
LinkOut - more resources
Full Text Sources
Molecular Biology Databases
Miscellaneous

