. 2010 Jun;59(6):1302-11.
doi: 10.2337/db09-1625. Epub 2010 Feb 25.

Molecular characterization of insulin-mediated suppression of hepatic glucose production in vivo

Affiliations

Molecular characterization of insulin-mediated suppression of hepatic glucose production in vivo

Christopher J Ramnanan et al. Diabetes. 2010 Jun.

Abstract

Objective: Insulin-mediated suppression of hepatic glucose production (HGP) is associated with sensitive intracellular signaling and molecular inhibition of gluconeogenic (GNG) enzyme mRNA expression. We determined, for the first time, the time course and relevance (to metabolic flux) of these molecular events during physiological hyperinsulinemia in vivo in a large animal model.

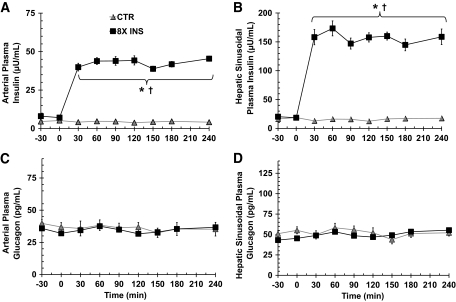
Research design and methods: 24 h fasted dogs were infused with somatostatin, while insulin (basal or 8 x basal) and glucagon (basal) were replaced intraportally. Euglycemia was maintained and glucose metabolism was assessed using tracer, (2)H(2)O, and arterio-venous difference techniques. Studies were terminated at different time points to evaluate insulin signaling and enzyme regulation in the liver.

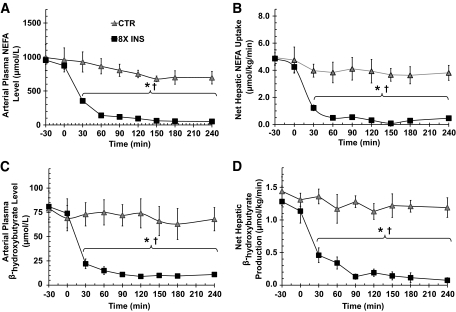
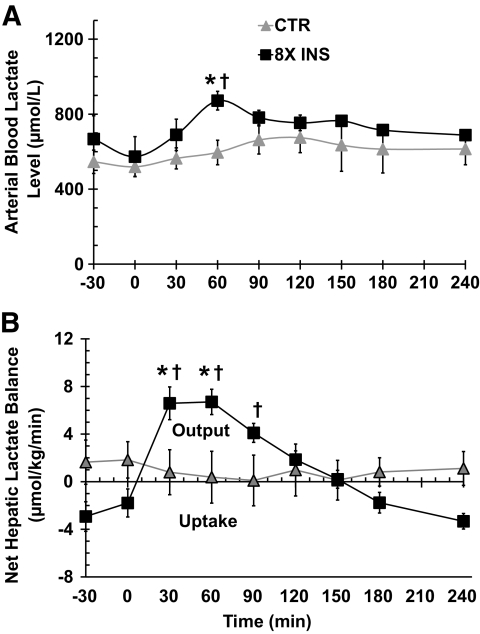
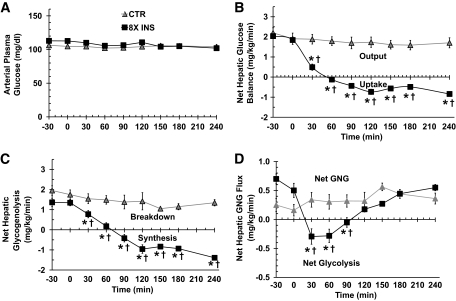
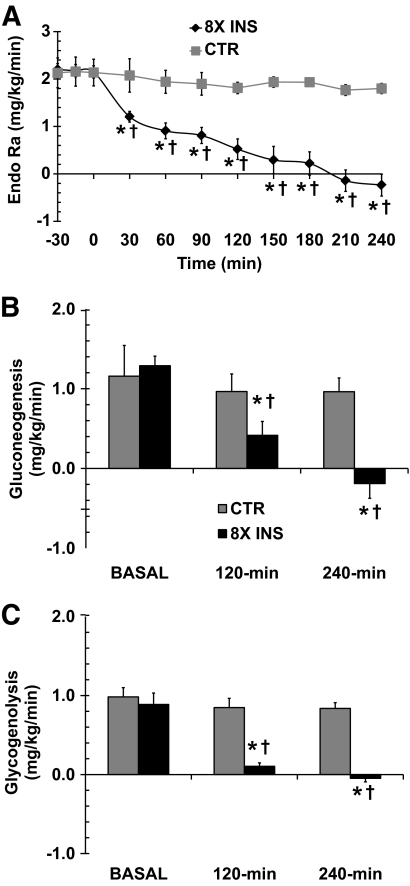
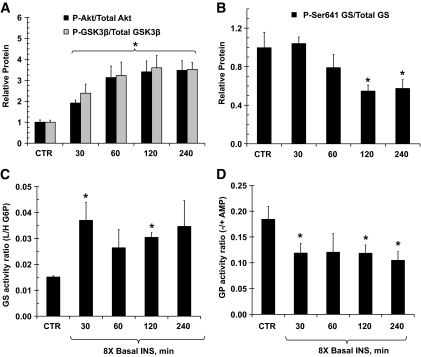
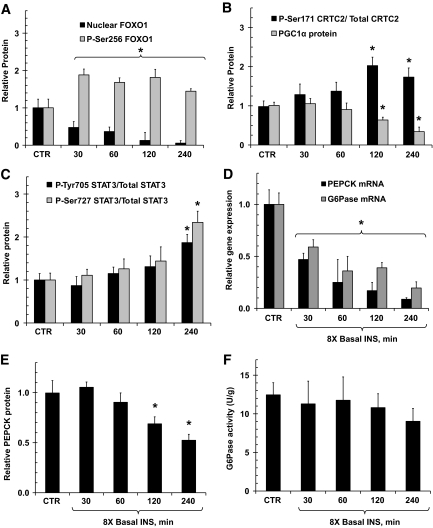
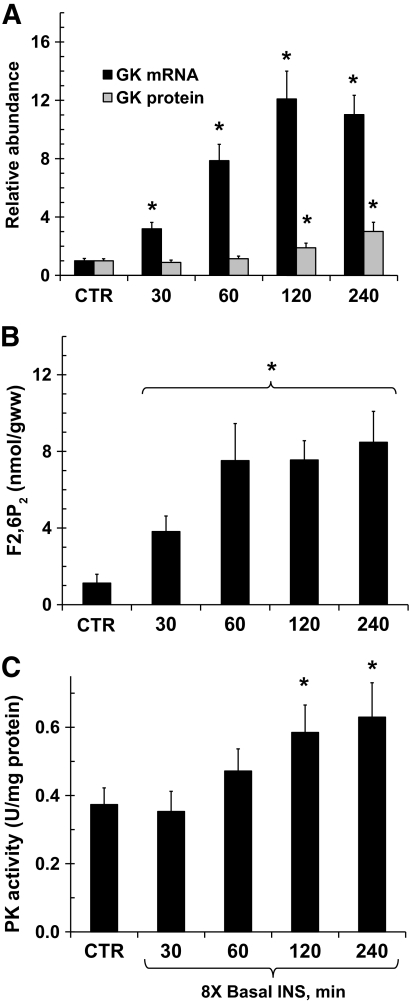
Results: Hyperinsulinemia reduced HGP due to a rapid transition from net glycogen breakdown to synthesis, which was associated with an increase in glycogen synthase and a decrease in glycogen phosphorylase activity. Thirty minutes of hyperinsulinemia resulted in an increase in phospho-FOXO1, a decrease in GNG enzyme mRNA expression, an increase in F2,6P(2), a decrease in fat oxidation, and a transient decrease in net GNG flux. Net GNG flux was restored to basal by 4 h, despite a substantial reduction in PEPCK protein, as gluconeogenically-derived carbon was redirected from lactate efflux to glycogen deposition.

Conclusions: In response to acute physiologic hyperinsulinemia, 1) HGP is suppressed primarily through modulation of glycogen metabolism; 2) a transient reduction in net GNG flux occurs and is explained by increased glycolysis resulting from increased F2,6P(2) and decreased fat oxidation; and 3) net GNG flux is not ultimately inhibited by the rise in insulin, despite eventual reduction in PEPCK protein, supporting the concept that PEPCK has poor control strength over the gluconeogenic pathway in vivo.


Figures

FIG. 1.
FIG. 1.
Arterial plasma insulin (A), hepatic sinusoidal plasma insulin (B), arterial plasma glucagon (C), and hepatic sinusoidal plasma glucagon concentrations (D) in 24 h fasted conscious dogs during the basal (−30 to 0 min) and experimental (0–240 min) periods. Data are means ± SEM; n = 7 in control (CTR) and n = 20 in 8× insulin (8X INS) groups. *P < 0.05 vs. CTR group; †P < 0.05 vs. basal period.
FIG. 2.
FIG. 2.
Arterial plasma NEFA levels (A), net hepatic NEFA uptake (B), arterial plasma β-hydroxybutyrate levels (C), and net hepatic β-hydroxybutyrate production (D) in 24 h fasted conscious dogs during the basal (−30 to 0 min) and experimental (0–240 min) periods. Data are means ± SEM; n = 7 in control (CTR) and n = 20 in 8× insulin (8X INS) groups. *P < 0.05 vs. CTR group; †P < 0.05 vs. basal period.
FIG. 3.
FIG. 3.
Arterial blood lactate concentrations (A) and net hepatic lactate uptake (B) in 24 h fasted conscious dogs during the basal (−30 to 0 min) and experimental (0–240 min) periods. Data are means ± SEM; n = 7 in control (CTR) and n = 20 in 8× insulin (8X INS) groups. *P < 0.05 vs. CTR group; †P < 0.05 vs. basal period.
FIG. 4.
FIG. 4.
Arterial plasma glucose levels (A), net hepatic glucose balance (B), net hepatic glycogenolytic flux (C), and net hepatic gluconeogenic flux (D) in 24 h fasted conscious dogs during the basal (−30 to 0 min) and experimental (0–240 min) periods. Data are means ± SEM; n = 7 in CTR and n = 20 in 8× insulin (8X INS) groups. *P < 0.05 vs. CTR group; †P < 0.05 vs. basal period.
FIG. 5.
FIG. 5.
Tracer-determined endogenous glucose production (A), whole-body gluconeogenesis (B), and whole-body glycogenolysis (C) determined using the 2H2O method in 24 h fasted conscious dogs during the basal (−30 to 0 min) and experimental (0–240 min) periods. Deuterated water analysis was performed on subsets of control (CTR) and hyperinsulinemic experiments that were carried out for 240 min (n = 3 and n = 5, respectively). Data represent means ± SEM; *P < 0.05 vs. CTR group, †P < 0.05 vs. basal period. 8X INS, 8× insulin.
FIG. 6.
FIG. 6.
Molecular regulation of glycogen metabolism in 24 h fasted conscious dogs after either CTR or 8X INS treatments. A: Akt and GSK3β phosphorylation, expressed relative to total Akt and GSK3β protein content, respectively. B: Phosphorylation of glycogen synthase, expressed relative to total glycogen synthase. C: Glycogen synthase activity ratio (independent versus total, measured using 0.1 vs. 10 mmol/l G6P, respectively). D: Glycogen phosphorylase activity ratio (independent versus total, measured in the absence versus presence [3 mmol/l] of AMP, respectively). Histograms depict mean values ± SEM. *Significantly different from the value for control (CTR), P < 0.05. 8X INS, 8× insulin.
FIG. 7.
FIG. 7.
Molecular regulation of GNG in 24 h fasted conscious dogs after either control (CTR) or 8× insulin (8X INS) treatments. A: FOXO1 phosphorylation and relative FOXO1 abundance in nuclear extracts. B: CRTC2 phosphorylation relative to CRTC2 total protein and PGC1α protein levels. C: STAT3 phosphorylation expressed relative to total STAT3 protein. D: Relative mRNA levels of PEPCK and G6Pase. E: PEPCK protein levels. F: G6Pase activity levels. Histograms depict mean values ± SEM. *Significantly different from the value for CTR, P < 0.05.
FIG. 8.
FIG. 8.
A: Relative glucokinase (GK) mRNA expression and protein levels. B: Hepatic levels of F2,6P2 (expressed per gram wet weight, gww). C: Hepatic pyruvate kinase (PK) activity. Histograms depict mean values ± SEM. *Significantly different from the value for CTR, P < 0.05.

References

    1. Adkins A, Basu R, Persson M, Dicke B, Shah P, Vella A, Schwenk WF, Rizza R: Higher insulin concentrations are required to suppress gluconeogenesis than glycogenolysis in nondiabetic humans. Diabetes 2003; 52: 2213–2220 - PubMed
    1. Boden G, Cheung P, Homko C: Effects of acute insulin excess and deficiency on gluconeogenesis and glycogenolysis in type 1 diabetes. Diabetes 2003; 52: 133–137 - PubMed
    1. Boden G, Cheung P, Stein TP, Kresge K, Mozzoli M: FFA cause hepatic insulin resistance by inhibiting insulin suppression of glycogenolysis. Am J Physiol Endocrinol Metab 2002; 283: E12–E19 - PubMed
    1. Cherrington AD: Banting Lecture 1997. Control of glucose uptake and release by the liver in vivo. Diabetes 1999; 48: 1198–1214 - PubMed
    1. Edgerton DS, Cardin S, Emshwiller M, Neal D, Chandramouli V, Schumann WC, Landau BR, Rossetti L, Cherrington AD: Small increases in insulin inhibit hepatic glucose production solely caused by an effect on glycogen metabolism. Diabetes 2001; 50: 1872–1882 - PubMed

Publication types

MeSH terms