. 2010 Jun 18;285(25):19092-105.
doi: 10.1074/jbc.M110.104430. Epub 2010 Feb 25.

Transcriptional regulation of the base excision repair pathway by BRCA1

Affiliations

Transcriptional regulation of the base excision repair pathway by BRCA1

Tapas Saha et al. J Biol Chem. .

Abstract

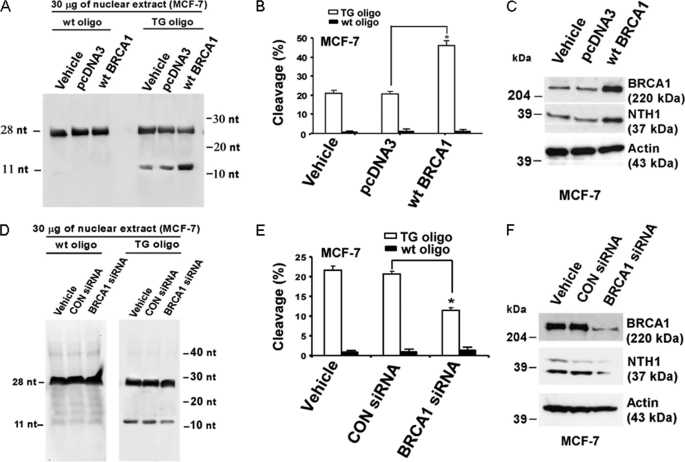
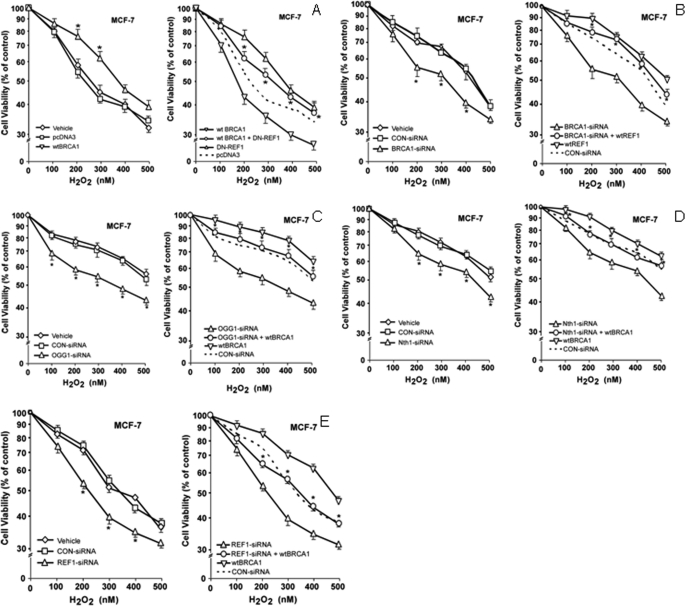
Inactivation of the breast cancer susceptibility gene BRCA1 plays a significant role in the development of a subset of breast cancers, although the major tumor suppressor function of this gene remains unclear. Previously, we showed that BRCA1 induces antioxidant-response gene expression and protects cells against oxidative stress. We now report that BRCA1 stimulates the base excision repair pathway, a major mechanism for the repair of oxidized DNA, by stimulating the activity of key base excision repair (BER) enzymes, including 8-oxoguanine DNA glycosylase (OGG1), the DNA glycosylase NTH1, and the apurinic endonuclease redox factor 1/apurinic endonuclease 1 (REF1/APE1), in human breast carcinoma cells. The increase in BER enzyme activity appears to be due, primarily, to an increase in enzyme expression. The ability of BRCA1 to stimulate the expression of the three BER enzymes and to enhance NTH1 promoter activity was dependent upon the octamer-binding transcription factor OCT1. Finally, we found that OGG1, NTH1, and REF1/APE1 each contribute to the BRCA1 protection against oxidative stress due to hydrogen peroxide and that hydrogen peroxide stimulates the expression of BRCA1 and the three BER enzymes. These findings identify a novel mechanism through which BRCA1 may regulate the repair of oxidative DNA damage.


Figures

FIGURE 1.
FIGURE 1.
BRCA1 regulates DNA cleavage at a TG site. A–C, proliferating MCF-7 cells were transiently transfected overnight with vehicle, wild-type BRCA1 (WTBRCA1), or empty pcDNA3 vector, washed, and allowed to recover for several hours prior to assay. Nuclear extracts were prepared, and 30-μg aliquots were tested for their ability to incise duplex oligonucleotides (oligo) containing a TG lesion, using the corresponding wild-type duplex oligonucleotide as a control. A shows a representative DNA gel; B shows the quantitative extents of cleavage, expressed as means ± S.E. of three independent experiments. The protein levels of BRCA1, NTH1, and α-actin for the different transfection conditions are shown in C. D–F, MCF-7 cells were treated with BRCA1-siRNA (100 nm), control (CON)-siRNA, or vehicle only and assayed for incising activity at a TG site as described above. D shows a representative DNA gel; E shows the quantitative extent of cleavage. The BRCA1, NTH1, and actin protein levels for the different treatment conditions are shown in F. B and E, an asterisk represents a statistically significant difference (p < 0.05, two-tailed t test). nt, nucleotide.
FIGURE 2.
FIGURE 2.
BRCA1 regulates DNA cleavage at an 8-oxoguanine site. A–C, proliferating MCF-7 cells were transiently transfected overnight with vehicle only, WTBRCA1, or empty pcDNA3 vector, washed, and allowed to recover for several hours prior to assay. Nuclear extracts were prepared, and 100-μg aliquots were tested for their ability to incise duplex oligonucleotides (oligo) containing an 8-OxoG lesion, using the corresponding wild-type duplex oligonucleotide as a negative control. A shows a representative DNA gel; B shows the quantitative extents of cleavage, expressed as means ± S.E. of three independent experiments. Western blots showing the protein levels of BRCA1, OGG1, and α-actin (control for loading and transfer) for the different transfection conditions are provided in C. D–F, MCF-7 cells were treated with BRCA1-siRNA (100 nm), control (CON)-siRNA (100 nm), or vehicle only for 72 h, after which nuclear extracts were prepared and assayed for incising activity as above. D shows a representative DNA gel; E shows the quantified extent of cleavage, expressed as means ± S.E. of three independent experiments. The protein levels of BRCA1, OGG1, and α-actin for the different treatment conditions are shown in F. *, p < 0.05 (two-tailed t test). nt, nucleotide.
FIGURE 3.
FIGURE 3.
BRCA1 regulates DNA cleavage at an AP site. A–C, MCF-7 cells were transfected with vehicle, WTBRCA1, or empty pcDNA3 vector; and aliquots of nuclear extract (50 μg) aliquots were assayed for incising activity around an AP site in a duplex oligonucleotide (oligo). A shows a representative assay; B shows the quantification of cleavage (based on three independent experiments); C shows the BRCA1, REF1/APE1, and α-actin protein levels for the different transfection conditions. D–F, MCF-7 cells were treated with BRCA1-siRNA (100 nm), control (CON)-siRNA, or vehicle and assayed for incising activity as above. D shows a representative DNA gel; E shows the quantitative extent of cleavage. The BRCA1, REF1/APE1, and actin protein levels for the different treatment conditions are shown in F. *, p < 0.05 (two-tailed t test). nt, nucleotide.
FIGURE 4.
FIGURE 4.
BRCA1 regulates expression of BER enzymes. A and B, proliferating MCF-7 cells were transfected overnight with WTBRCA1, empty pcDNA3 vector, or vehicle only; washed; allowed to recover from the transfection in fresh culture medium, and harvested for semi-quantitative RT-PCR assays, as described under “Experimental Procedures.” Representative gels showing the amplified bands corresponding to BRCA1, OGG1, NTH1, REF1/APE1, XRCC1, and β-actin are provided in A. The PCR bands were quantified by densitometry, and the mRNA levels were normalized to β-actin and expressed relative to that of the vehicle control in B. The fold-change values are means ± S.E. of at least three independent experiments. *, p < 0.05 relative to vehicle control (two-tailed t test). C and D, MCF-7 cells transfected with expression vectors (C) or treated with siRNAs (D) as before were harvested and Western-blotted to detect BRCA1, XRCC1, ligase III, or actin (loading control (CON)).
FIGURE 5.
FIGURE 5.
Role of BER enzymes in BRCA1 protection against oxidative stress due to H2O2. A, proliferating MCF-7 cells in 6-well dishes were transfected overnight with the indicated expression vectors (using empty pcDNA3 vector to keep the total transfected DNA content constant); washed; post-incubated in fresh medium for 24 h to allow gene expression; harvested, and inoculated into 96-well plates in fresh medium. The cells were allowed to attach and recover for another 24 h; exposed to the indicated concentration of H2O2 for 24 h; and tested for cell viability by MTT assays. Values plotted are means ± S.E. of three independent experiments, with each experiment using 8 replicate wells per assay condition. B, MCF-7 cells in 6-well dishes were treated with BRCA1-siRNA (100 nm), control (CON)-siRNA (100 nm), or vehicle only for 72 h and then inoculated into 96-well plates for H2O2 survival assays as described above. For combination treatment with BRCA1-siRNA+WT-REF1, after incubation of the cells with siRNA (100 nm) for 24 h, was transfected with WT-REF1 overnight and allowed to recover for another 24 h. The cells were then harvested, inoculated into 96-well dishes, and assayed for sensitivity to H2O2 as above. In the left panels, significant increases in survival due to WTBRCA1 (relative to pcDNA3 vector) or reductions in survival due to BRCA1-siRNA (relative to control (CON)-siRNA) are indicated by an asterisk (p < 0.05). In the right panels, the asterisks represent significant comparisons of WTBRCA1+DN-REF1 versus DN-REF alone or BRCA1-siRNA+WT-REF1 versus BRCA1-siRNA alone. C–E, treatments with siRNA alone or combinations of siRNA plus WTBRCA1 vector and subsequent assays of cellular sensitivity to H2O2 were carried out as above. The effects of siRNAs for OGG1 (C), NTH1 (D), and REF1 (E) are shown. Cell viability values are means ± S.E. of three independent experiments and are normalized to the control (vehicle only) treatment. Significant reductions in survival due to OGG1-siRNA, NTH1-siRNA, or REF1-siRNA (left panels) (relative to control (CON)-siRNA) are indicated by an asterisk (p < 0.05). In right panels, increases in survival due to a combination of BER enzyme-siRNA plus WTBRCA1 (relative to BER enzyme-siRNA alone) are shown by an asterisk (p < 0.05).
FIGURE 6.
FIGURE 6.
Expression of WT-REF1 and DN-REF1 and efficacy of BER enzyme knockdowns. MCF-7 cells were transfected with WT-REF1 (A) or DN-REF (B) or treated with REF1-siRNA (C), OGG1-siRNA (D), or NTH1-siRNA (E), as described above. The cells were then harvested for Western blotting to detect the indicated BER enzyme or actin.
FIGURE 7.
FIGURE 7.
Role of OCT1 in stimulation of BER enzyme expression due to BRCA1 overexpression. A and B, T47D cells were treated with control (CON)-siRNA or OCT1-siRNA (100 nm for 48 h) and then transfected overnight with either a wild-type (wt) BRCA1 expression vector (+) or empty pcDNA3 vector (−). The cells were post-incubated for 24 h to allow gene expression and then subjected to Western blotting to detect the indicated proteins. α-Actin was used as a control for loading and transfer. A shows a typical Western blot. B shows quantification of these experiments by densitometry. Values plotted are means ± S.E. of the fold-change (ratio of protein/actin normalized to control-siRNA and empty vector transfection value) based on three independent experiments. C and D, T47D cells were treated with control (CON)-siRNA or OCT1-siRNA and transfected with WTBRCA1 (+) or empty pcDNA3 vector (−), as above; and 30-μg aliquots of nuclear extracts were tested for incision of duplex oligonucleotides containing a TG lesion, using the corresponding wild-type oligonucleotide as a control. C shows a representative DNA gel and D shows quantification of three separate experiments. *, p < 0.05.
FIGURE 8.
FIGURE 8.
BRCA1 regulates NTH1 promoter activity. A, T47D cells were co-transfected overnight with WTBRCA1 (or empty pcDNA3 vector) and with an NTH1 luciferase (NTH1-Luc) reporter (containing 1.2-kb of NTH1 promoter sequence upstream of the translation start site) or the empty pGL3-Luc reporter plasmid. The cells were then post-incubated for 24 h to allow gene expression and harvested for luciferase assays. Luciferase values are expressed as fold-change relative to control conditions (= 1.0) (pcDNA3+NTH1-Luc). B, T47D cells were pretreated with control (CON)-siRNA or BRCA1-siRNA (100 nm for 48 h), transfected with NTH1-Luc (1.2 kb) or pGL3-Luc, and assayed as above. Luciferase values were expressed as fold-change relative to control conditions (= 1.0) (CON-siRNA+NTH1-Luc). C, T47D cells were pretreated with control-siRNA or OCT1-siRNA, co-transfected overnight with WTBRCA1 (+) or empty vector (−) plus NTH1-Luc (1.2 kb) reporter, post-incubated for 24 h to allow gene expression, and harvested for luciferase assays. Luciferase values are expressed as fold-change relative to control conditions (= 1.0) (CON-siRNA+NTH1-Luc). In all experiments, luciferase values are means ± S.E. of three independent experiments. p values were calculated using two-tailed t tests. *, p < 0.05.
FIGURE 9.
FIGURE 9.
BRCA1 overexpression does not stimulate NTH1 promoter activity in Oct1 null (Oct1−/−) MEFs. A and B, wild-type (Oct1+/+) (A) or Oct1−/− (B) MEFs were co-transfected with WTBRCA1 (versus empty pcDNA3 vector) and the NTH1-Luc (1.2 kb) or empty pGL3-Luc reporter overnight, post-incubated for 24 h to allow gene expression, and assayed for luciferase activity. Luciferase values are expressed as fold-change relative to control (= 1.0) (pcDNA3+NTH1-Luc). C, compares the activities of the NTH1-Luc (1.2 kb) reporter in Oct1+/+ versus Oct1−/− MEFs. All values are means ± S.E. of three independent experiments. p values were calculated using two-tailed t tests. *, p < 0.05.
FIGURE 10.
FIGURE 10.
Role of Oct1 in BRCA1 protection against H2O2. Oct1+/+ or Oct1−/− fibroblasts were transfected as indicated and then assayed for sensitivity to H2O2, as described in Fig. 5 legend. Significant differences in cell viability (p < 0.05) between WTBRCA1-transfected and pcDNA3 vector-transfected cells are indicated by an asterisk in A and B. C, compares the survival of pcDNA3-transfected Oct1+/+ versus Oct1−/− fibroblasts.
FIGURE 11.
FIGURE 11.
Oxidative stress due to H2O2 stimulates BRCA1 and BER enzyme expression. A, subconfluent proliferating T47D cells were treated with H2O2 (250 nm) for 0, 2, or 24 h and then harvested for Western blotting to detect BRCA1, NTH1, OGG1, REF1/APE1, and actin (loading control). B, T47D cells were treated with H2O2 (250 nm) for 24 h and then harvested for NTH1 incising activity assays as described in Fig. 1 legend. nt, nucleotide.

Similar articles

Cited by

References

    1. Hegde M. L., Hazra T. K., Mitra S. (2008) Cell Res. 18, 27–47 - PMC - PubMed
    1. D'Errico M., Parlanti E., Dogliotti E. (2008) Mutat. Res. 659, 4–14 - PubMed
    1. Mitra S., Hazra T. K., Roy R., Ikeda S., Biswas T., Lock J., Boldogh I., Izumi T. (1997) Mol. Cells 7, 305–312 - PubMed
    1. Izumi T., Wiederhold L. R., Roy G., Roy R., Jaiswal A., Bhakat K. K., Mitra S., Hazra T. K. (2003) Toxicology 193, 43–65 - PubMed
    1. Kelley M. R., Parsons S. H. (2001) Antioxid. Redox. Signal. 3, 671–683 - PubMed

Publication types