. 2010 Apr 23;285(17):13002-11.
doi: 10.1074/jbc.M109.086041. Epub 2010 Feb 25.

Activation of acid-sensing ion channel 1a (ASIC1a) by surface trafficking

Affiliations

Activation of acid-sensing ion channel 1a (ASIC1a) by surface trafficking

Sunghee Chai et al. J Biol Chem. .

Abstract

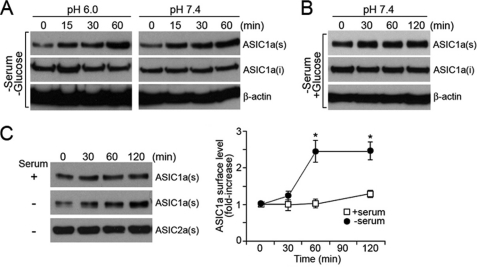
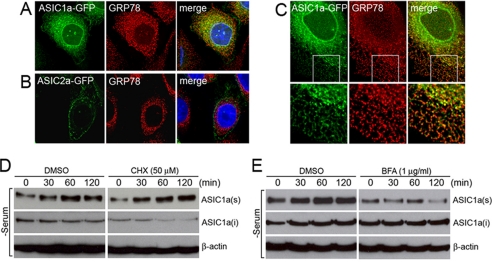
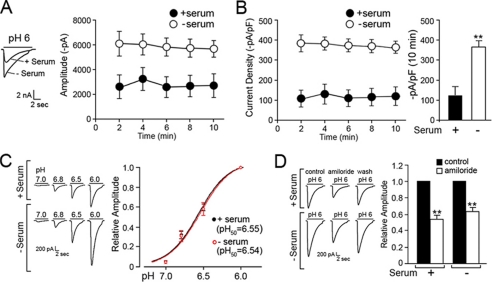
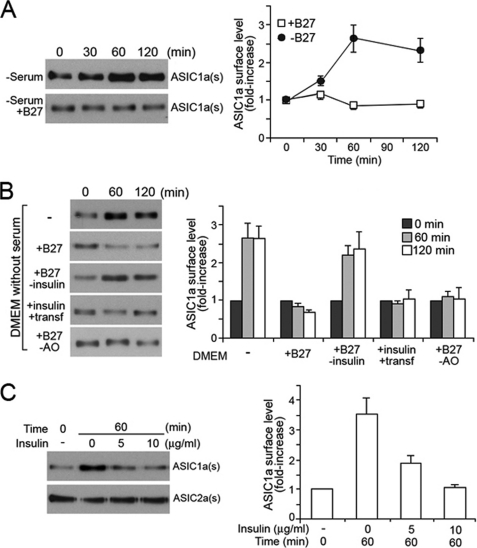
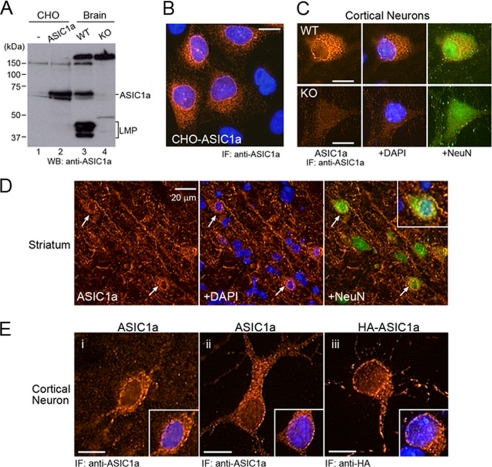
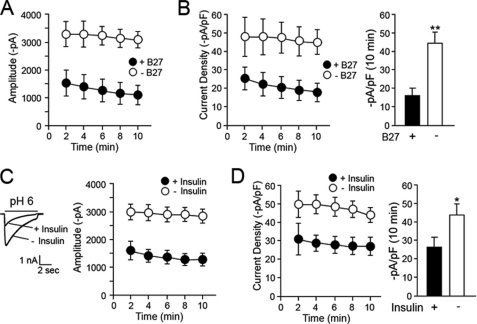
Acid-sensing ion channels (ASICs) are voltage-independent Na(+) channels activated by extracellular protons. ASIC1a is expressed in neurons in mammalian brain and is implicated in long term potentiation of synaptic transmission that contributes to learning and memory. In ischemic brain injury, however, activation of this Ca(2+)-permeable channel plays a critical role in acidosis-mediated, glutamate-independent, Ca(2+) toxicity. We report here the identification of insulin as a regulator of ASIC1a surface expression. In modeled ischemia using Chinese hamster ovary cells, serum depletion caused a significant increase in ASIC1a surface expression that resulted in the potentiation of ASIC1a activity. Among the components of serum, insulin was identified as the key factor that maintains a low level of ASIC1a on the plasma membrane. Neurons subjected to insulin depletion increased surface expression of ASIC1a with resultant potentiation of ASIC1a currents. Intracellularly, ASIC1a is predominantly localized to the endoplasmic reticulum in Chinese hamster ovary cells, and this intracellular localization is also observed in neurons. Under conditions of serum or insulin depletion, the intracellular ASIC1a is translocated to the cell surface, increasing the surface expression level. These results reveal an important trafficking mechanism of ASIC1a that is relevant to both the normal physiology and the pathological activity of this channel.


Figures

FIGURE 1.
FIGURE 1.
Surface biotinylation and Western blot analyses of surface-expressed ASIC1a. A, serum and glucose deprivation increases surface expression level of ASIC1a-FLAG in CHO cells both at pH 7.4 and pH 6. B, deprivation of serum alone increases surface expression levels of ASIC1a in the absence of serum. C, effect of serum on ASIC1a surface expression at pH 7.4. Surface levels detected by Western blot (left panel) and quantification of the Western blot results are shown as relative fold increases (right panel). The data represent the means ± S.E. of protein levels from at least four independent experiments, where an asterisk indicates p < 0.05 at the 60- and 120-min time points (Student's t test). Surface expression levels of ASIC2a-FLAG were shown as control. Anti-FLAG antibody was used to detect ASIC1a-FLAG and ASIC2a-FLAG. ASIC1a(s), surface located ASIC1a; ASIC1a(i), intracellular ASIC1a; β-actin: loading control.
FIGURE 2.
FIGURE 2.
ASIC1a is localized in the ER and accumulates in the plasma membrane upon serum depletion. A and B, subcellular distribution of ASIC1a-GFP and ASIC2a-GFP in CHO cells shown by confocal microscopy. GRP78 was immunostained for Colocalization with ASIC1a (top row) or ASIC2a (bottom row). C, colocalization of ASIC1a-GFP with GRP78 in the ER in CHO cells. Insets in the top row are shown in higher magnification in the bottom row. D, increase in surface-expressed ASIC1a during serum depletion does not require de novo protein synthesis. Inhibition of protein synthesis by 50 μm cycloheximide (CHX) does not prevent surface accumulation of ASIC1a during serum depletion. E, inhibition of the forward protein transport from the ER to the Golgi by 1 μg/ml brefeldin A (BFA) prevents surface accumulation of ASIC1a during serum depletion. D and E show cell surface biotinylation assay, and anti-FLAG antibody was used to detect ASIC1a-FLAG by Western blot analysis. In control cells, dimethyl sulfoxide (DMSO) was applied instead of cycloheximide or brefeldin A as vehicle. The cells were treated with dimethyl sulfoxide, cycloheximide, or brefeldin A 1 h prior to and during the serum depletion by incubation in Dulbecco's modified Eagle's medium without serum for indicated time periods (0, 30, 60, and 120 min). ASIC1a(s), surface located ASIC1a; ASIC1a(i), intracellular ASIC1a; β-actin, loading control. Representative blots of three independent experiments are shown.
FIGURE 3.
FIGURE 3.
Serum depletion increases ASIC1a current amplitudes in CHO cells without changing electrophysiological property of the channel. A, current amplitude of ASIC1a in the serum-replete and -depleted cells. Representatives of ASIC1a current traces with and without serum depletion were superimposed (left panel). The peak current amplitudes were measured for 10 min, and the value is plotted (right panel). B, analysis of peak current amplitudes in cell density. The current densities from untreated and serum-depleted cells are plotted as a function of time, where the significant differences (p < 0.01) were measured at all time points. The value at the 10-min time point is shown. C, pH responsive activity of ASIC1a in serum-replete and -depleted cells. ASIC1a was activated by exposure to pH ranging from 7 to 6. The peak current amplitudes were plotted as function of pH, and the pH of half-maximum activation (pH0.5) was measured for ASIC1a in untreated (black circles) and serum-depleted (red circles) cells. D, inhibition of ASIC1a activity in response to 100 μm amiloride. ASIC1a current amplitudes were recorded from the serum-replete and -depleted cells before (control), during (amiloride), and after (wash) the drug treatment. Relative amplitudes are shown to compare the changes in ASIC1a channel activity upon amiloride treatment. Statistical analysis was carried out using two-way ANOVA. The values are the means ± S.E. (n = 5–6), and ** indicates p < 0.01.
FIGURE 4.
FIGURE 4.
Insulin modulates surface expression of ASIC1a in CHO cells. A, serum supplement B27 maintains a low level of surface-expressed ASIC1a in the serum-depleted but B27-replete medium. B, effect of B27 components on surface expression of ASIC1a. The cells were treated in serum-depleted medium but supplemented with variants of B27. DMEM, Dulbecco's modified Eagle's medium. C, effect of insulin alone on surface expression of ASIC1a and ASIC2a in the serum-depleted medium. The data are from the Western blot analyses of the biotinylated surface ASIC1a. Representative blots are shown in the left panels, and quantification is shown in the right panels. The data represent the means ± S.E. of protein levels from at least four independent experiments. ASIC1a(s) and ASIC2a(s), surface located ASIC1a and ASIC2a, respectively. B27-insulin, B27 without insulin; B27-AO, B27 without antioxidants.
FIGURE 5.
FIGURE 5.
ASIC1a is localized in intracellular organelles in neurons. A, Western blot analyses of ASIC1a expressed in transfected CHO cells and in brain of the wild-type (WT) and knock-out (KO) mice. Anti-ASIC1a antibody detects ASIC1a and nonspecific protein bands of >150 and ∼50 kDa in lysates of CHO cells and brain. B, immunostaining of transfected CHO cells with ASIC1a antibody. C, immunostaining of cultured cortical neurons from the wild-type and knock-out mice with ASIC1a antibody. D, immunostaining of ASIC1a in brain slices from the wild-type mice. ASIC1a is localized proximal to nuclei, soma, and dendrites of neurons. Inset shows a neuron in a higher magnification. E, intracellular localization of ASIC1a in cortical neurons. Endogenous ASIC1a in neurons in brain slices (panel i) and in primary culture (panel ii), and HA-tagged ASIC1a (HA-ASIC1a) in transfected culture neurons (panel iii) are shown. LMP, low molecular mass proteins. B–E, nuclei were stained with 4′,6′-diamidino-2-phenylindole dihydrochloride (DAPI), and neurons were stained with NeuN. Scale bars in B, C, and E, 10 μm. WB, Western blot; IF, immunofluorescence.
FIGURE 6.
FIGURE 6.
Depletion of B27 or insulin increases ASIC1a currents in cortical neurons. A and B, depletion of B27 from the culture media increases acid (pH 6)-induced current amplitude and current density. The current densities of B-27 replete (+B-27) and deplete (−B-27) are plotted as a function of time (B, left panel), and the value at the 10-min time point is shown (B, right panel). C and D, insulin depletion increases acid-induced current amplitude and current density in neurons. Representatives of ASIC1a current traces with and without insulin depletion were superimposed (left panel in C). The current densities are plotted as a function of time (D, left panel), and the value at the 10-min time point is shown (D, right panel). Statistical analysis was carried out using two-way ANOVA and Student's t test. * and ** indicate p < 0.05 and p < 0.01, respectively. The values are the means ± S.E. (n = 5 for A and B, n = 10–13 for C and D).

Similar articles

Cited by

References

    1. García-Añoveros J., Derfler B., Neville-Golden J., Hyman B. T., Corey D. P. (1997) Proc. Natl. Acad. Sci. U.S.A. 94, 1459–1464 - PMC - PubMed
    1. Waldmann R., Champigny G., Bassilana F., Heurteaux C., Lazdunski M. (1997) Nature 386, 173–177 - PubMed
    1. Wemmie J. A., Chen J., Askwith C. C., Hruska-Hageman A. M., Price M. P., Nolan B. C., Yoder P. G., Lamani E., Hoshi T., Freeman J. H., Jr., Welsh M. J. (2002) Neuron 34, 463–477 - PubMed
    1. Wemmie J. A., Askwith C. C., Lamani E., Cassell M. D., Freeman J. H., Jr., Welsh M. J. (2003) J. Neurosci. 23, 5496–5502 - PMC - PubMed
    1. Wemmie J. A., Coryell M. W., Askwith C. C., Lamani E., Leonard A. S., Sigmund C. D., Welsh M. J. (2004) Proc. Natl. Acad. Sci. U.S.A. 101, 3621–3626 - PMC - PubMed

Publication types

MeSH terms

LinkOut - more resources